Century 21 People’s Choice Realty Inc., Brokerage
120 MATHESON BLVD E #103
MISSISSAUGA, Ontario
L4Z 1X1

Toronto, Newtonbrook West, M2N 0A5
$1,098,000$000000
Listed by FOREST HILL REAL ESTATE INC..
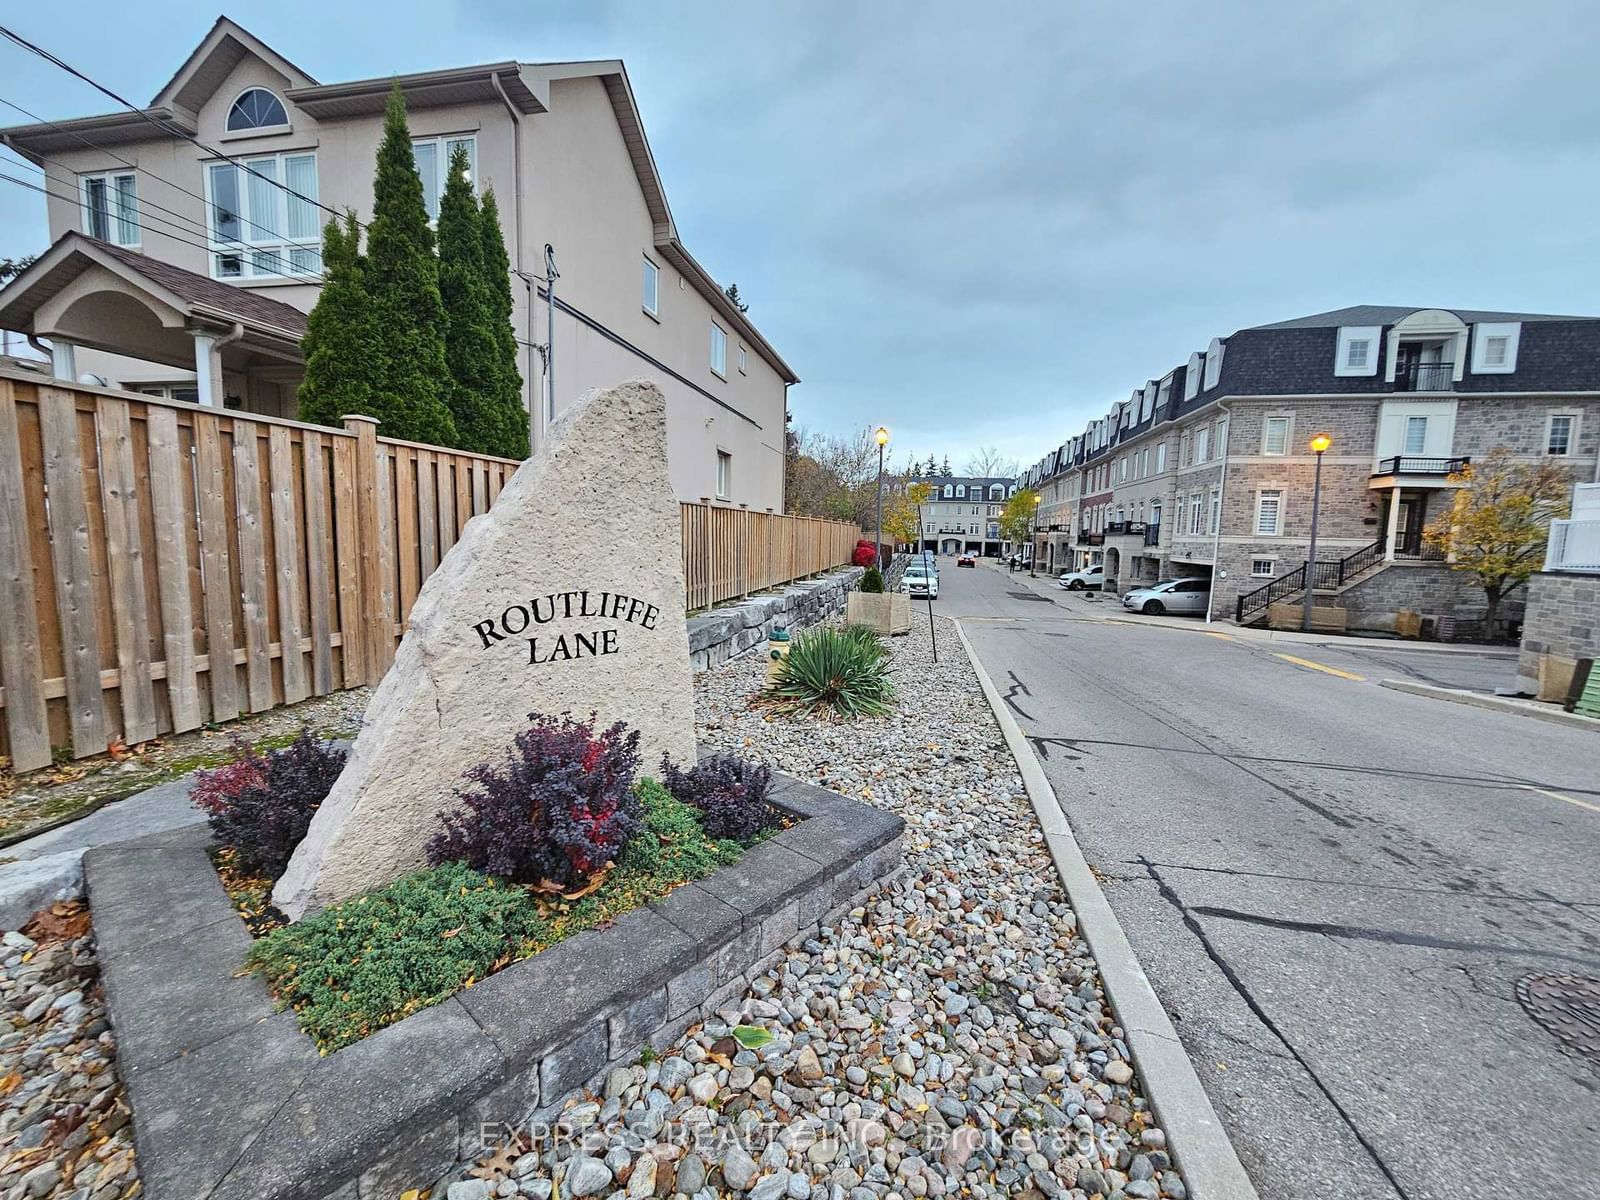
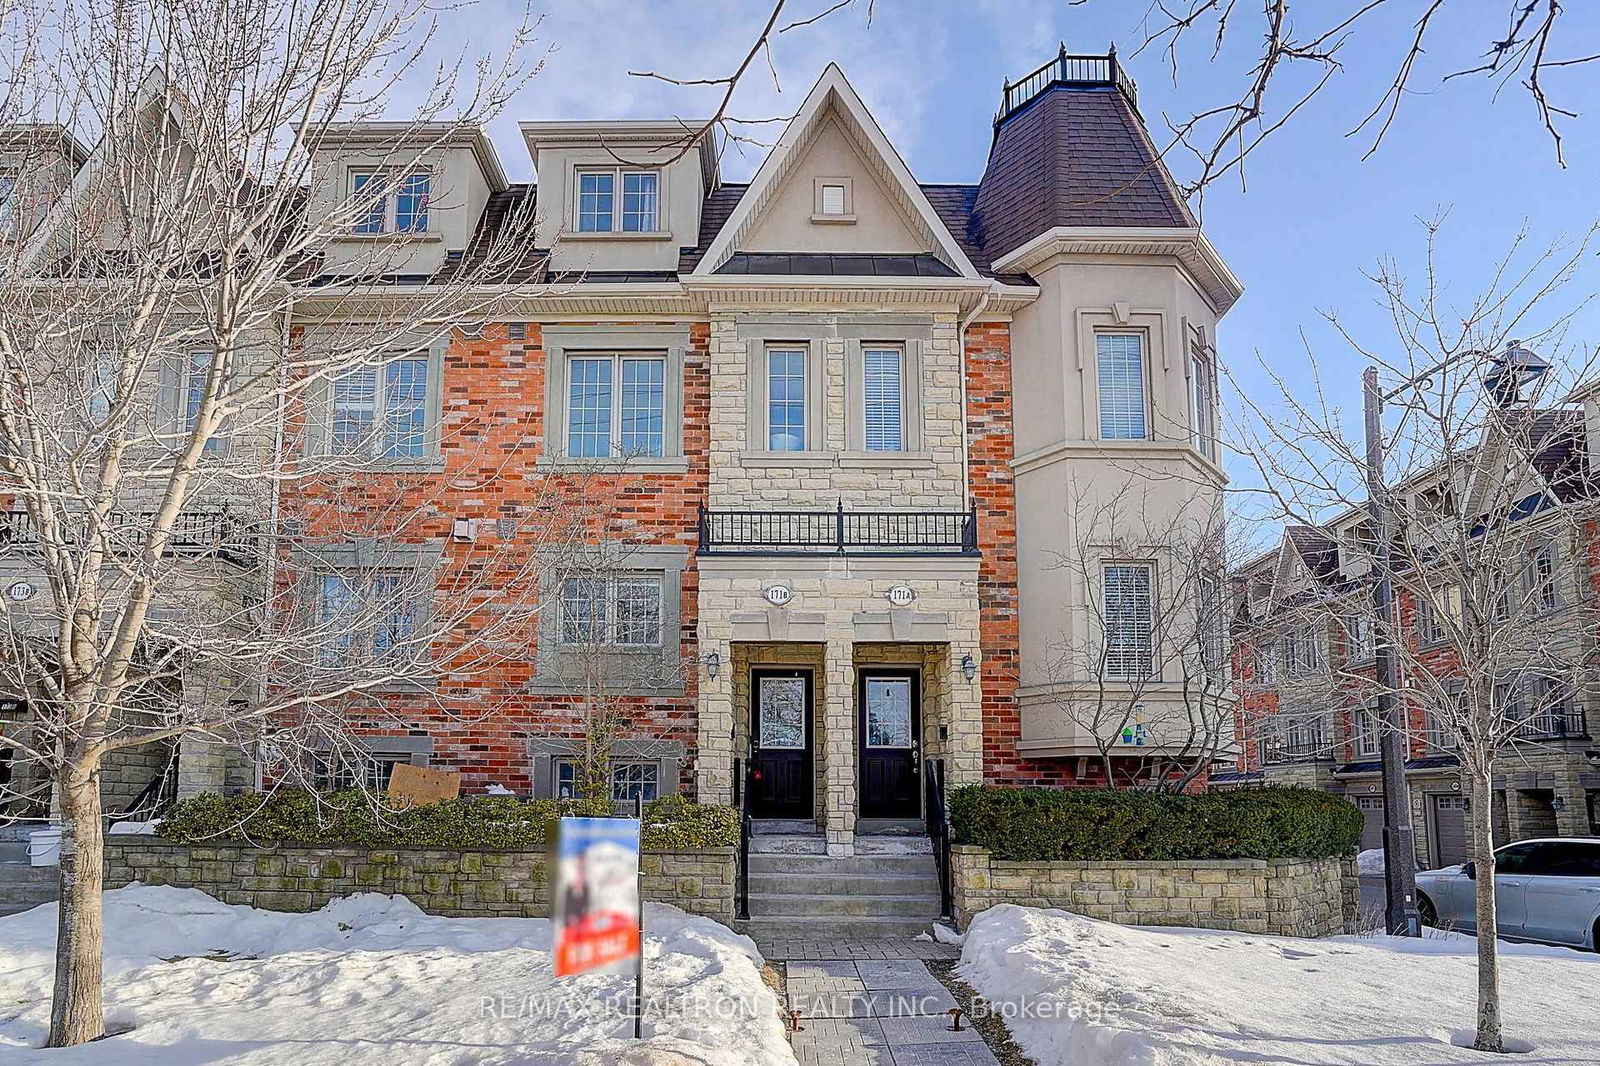
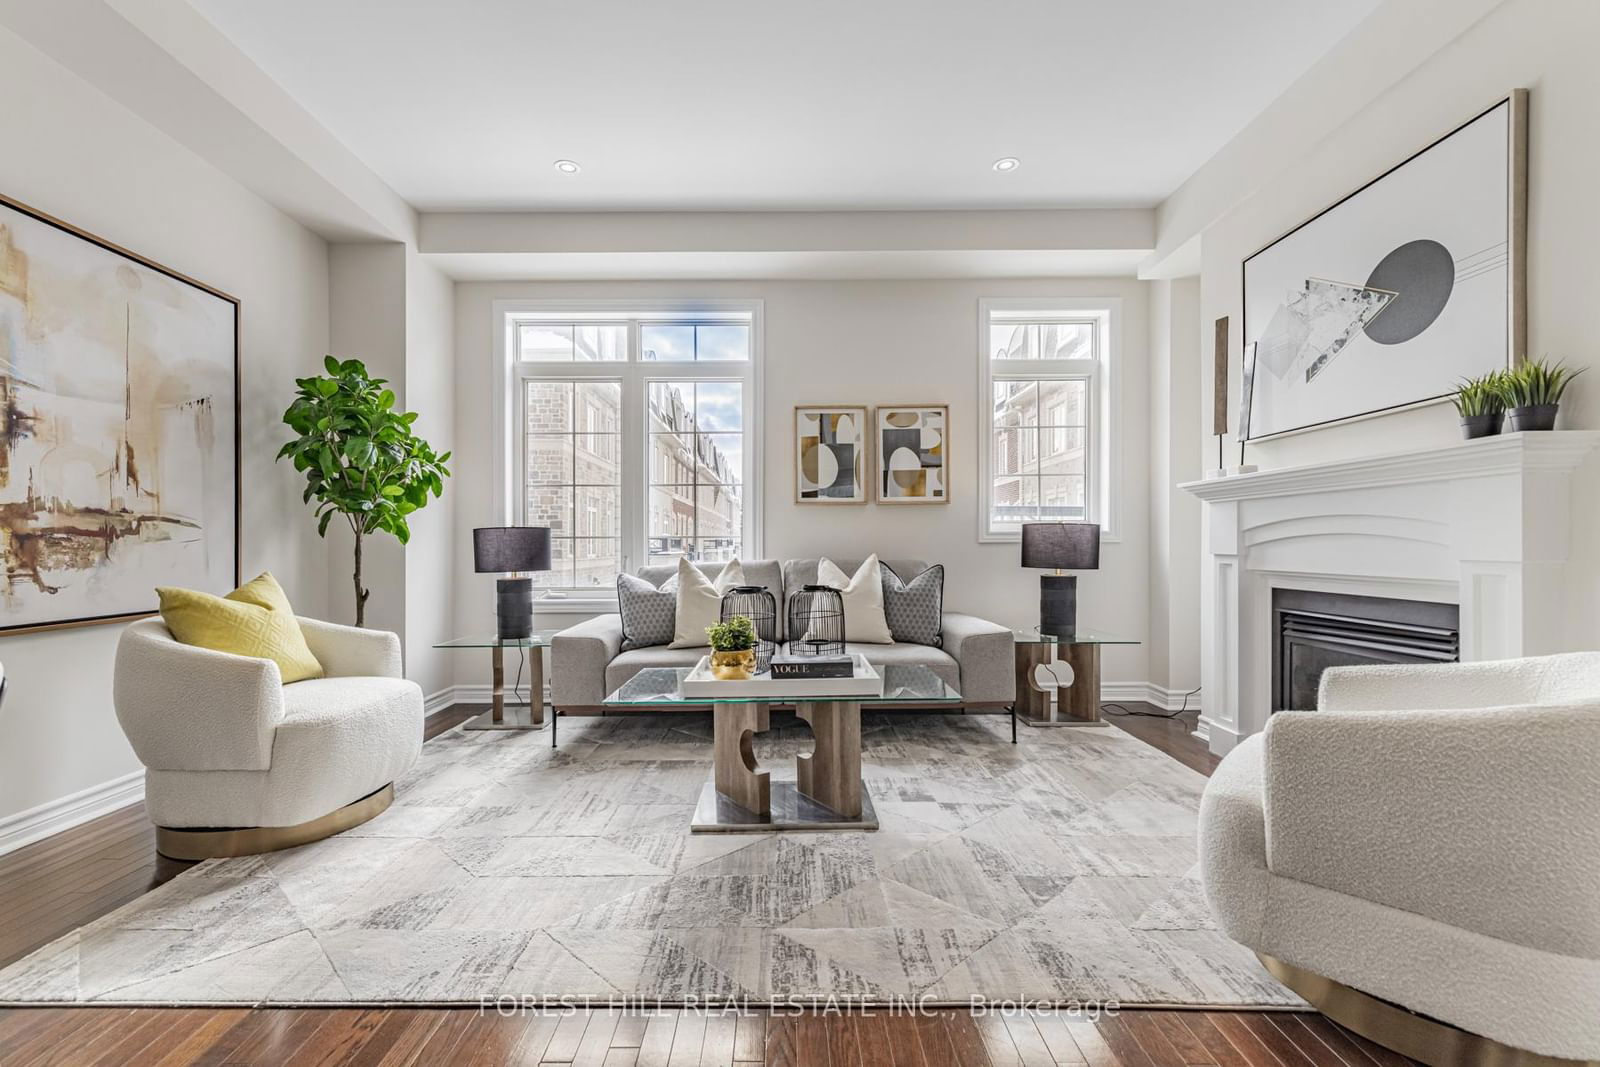
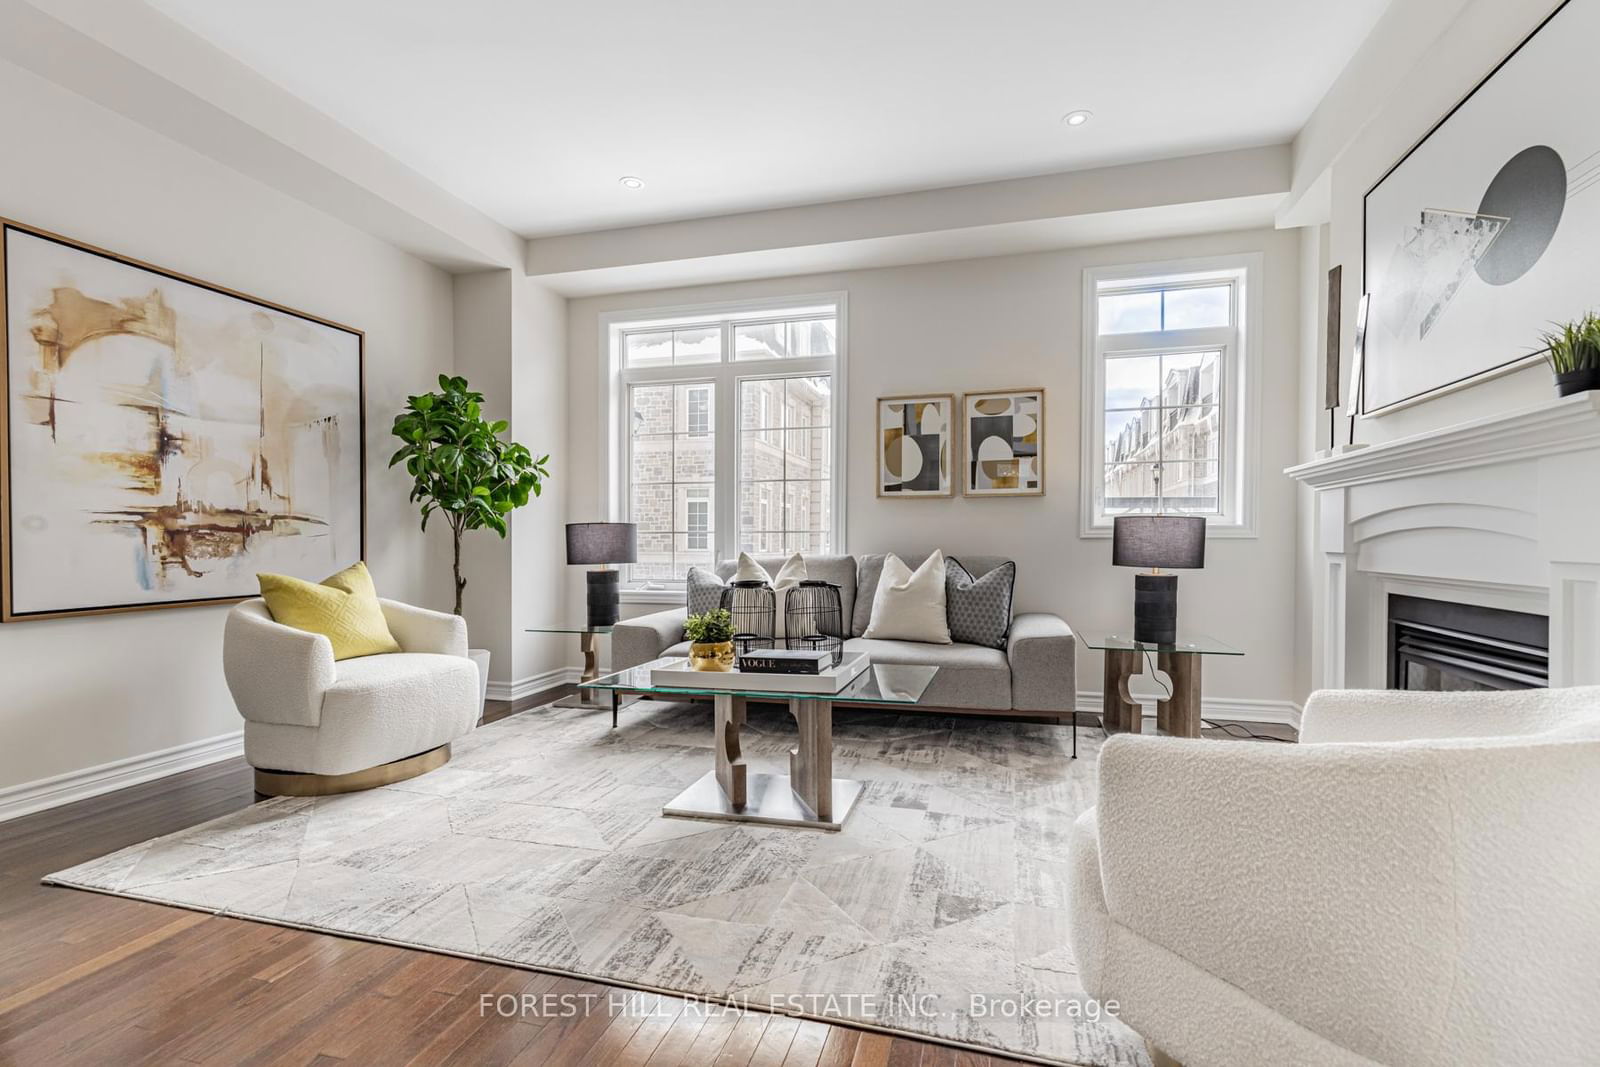
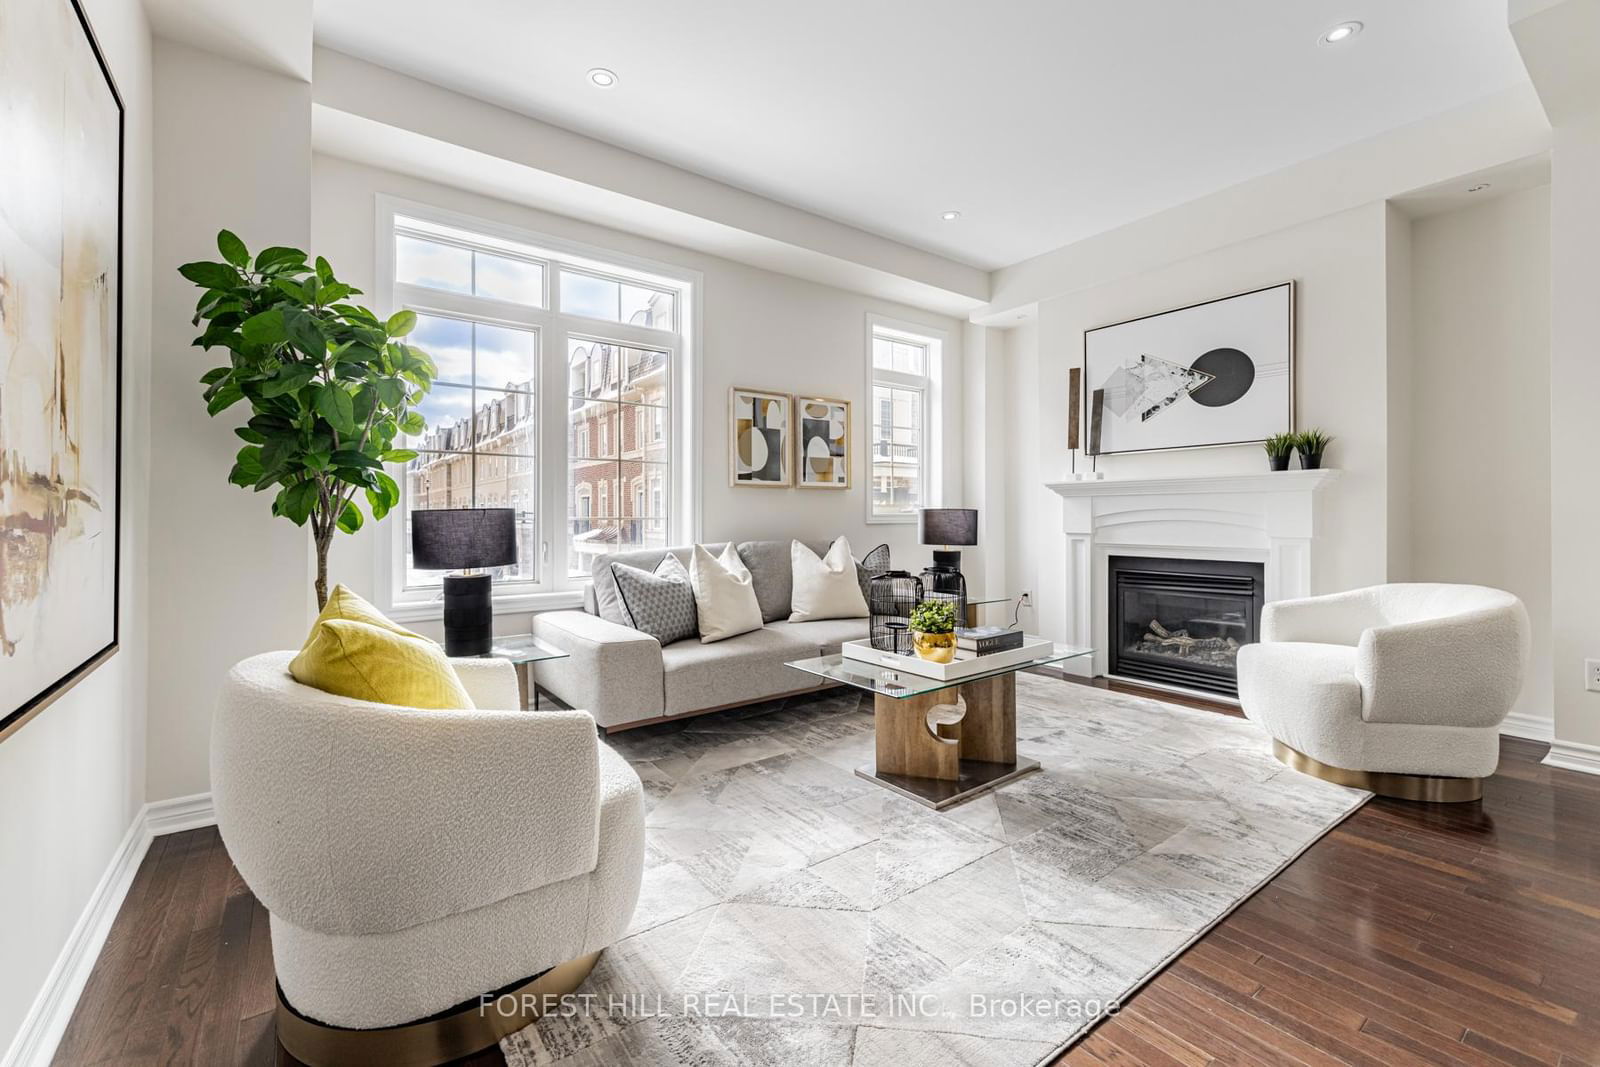
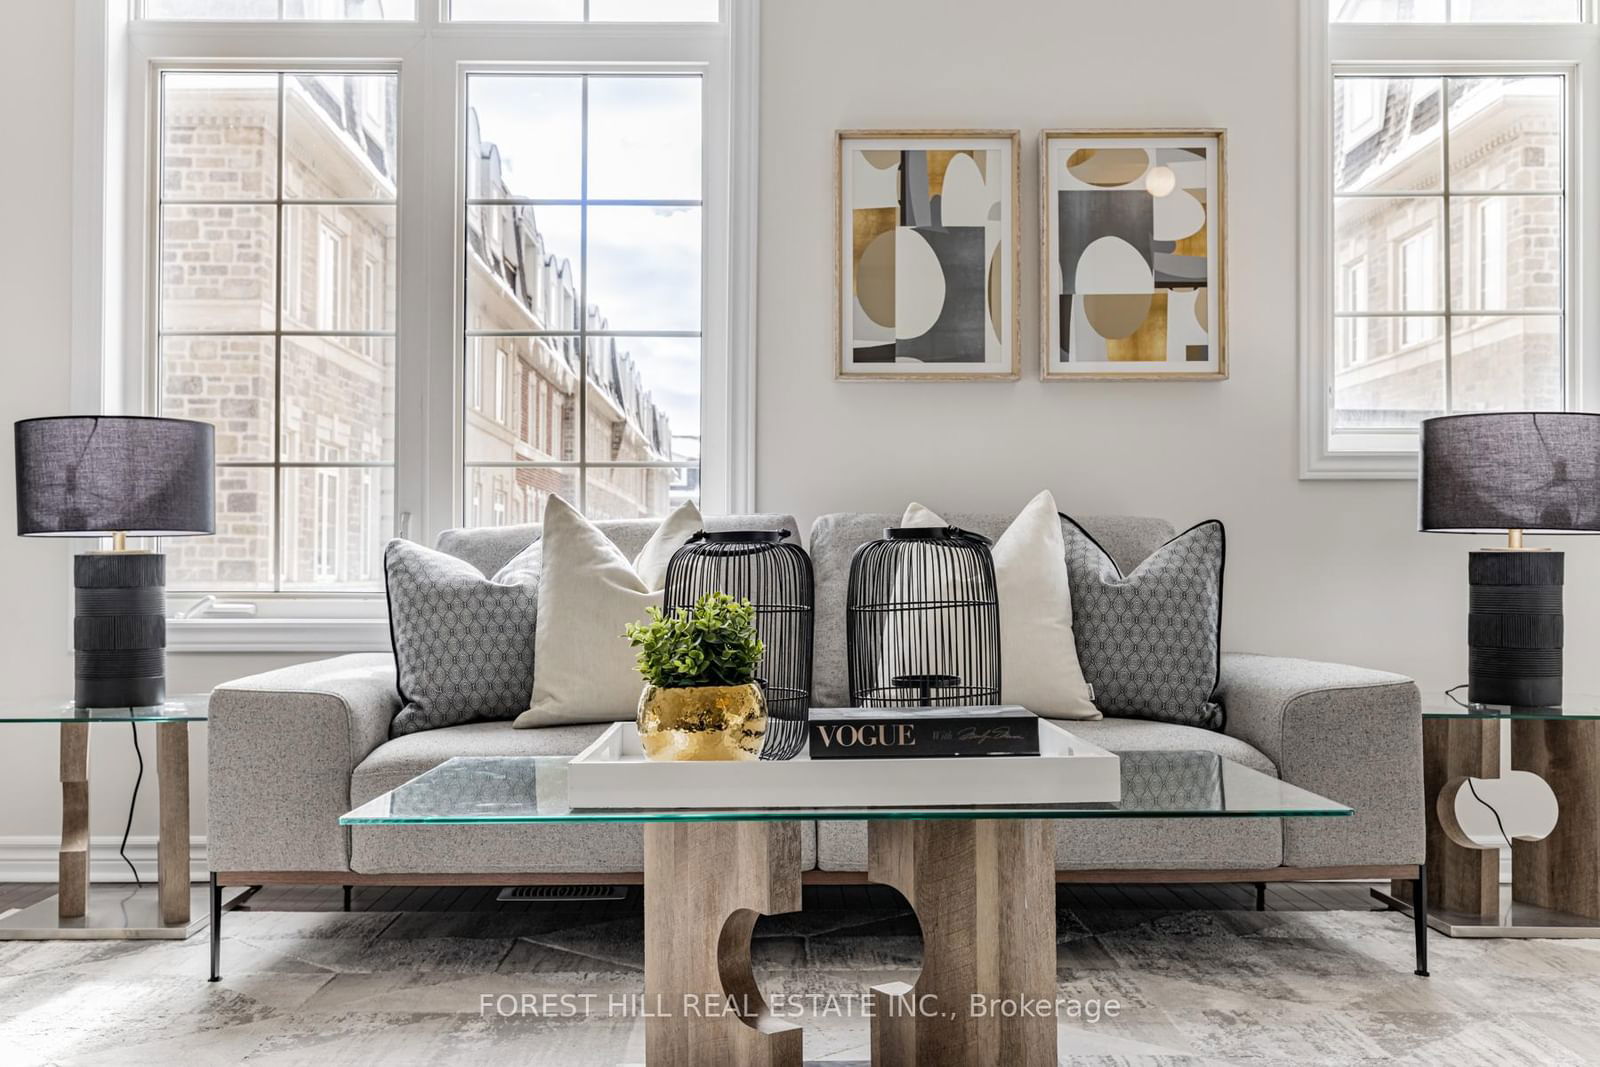
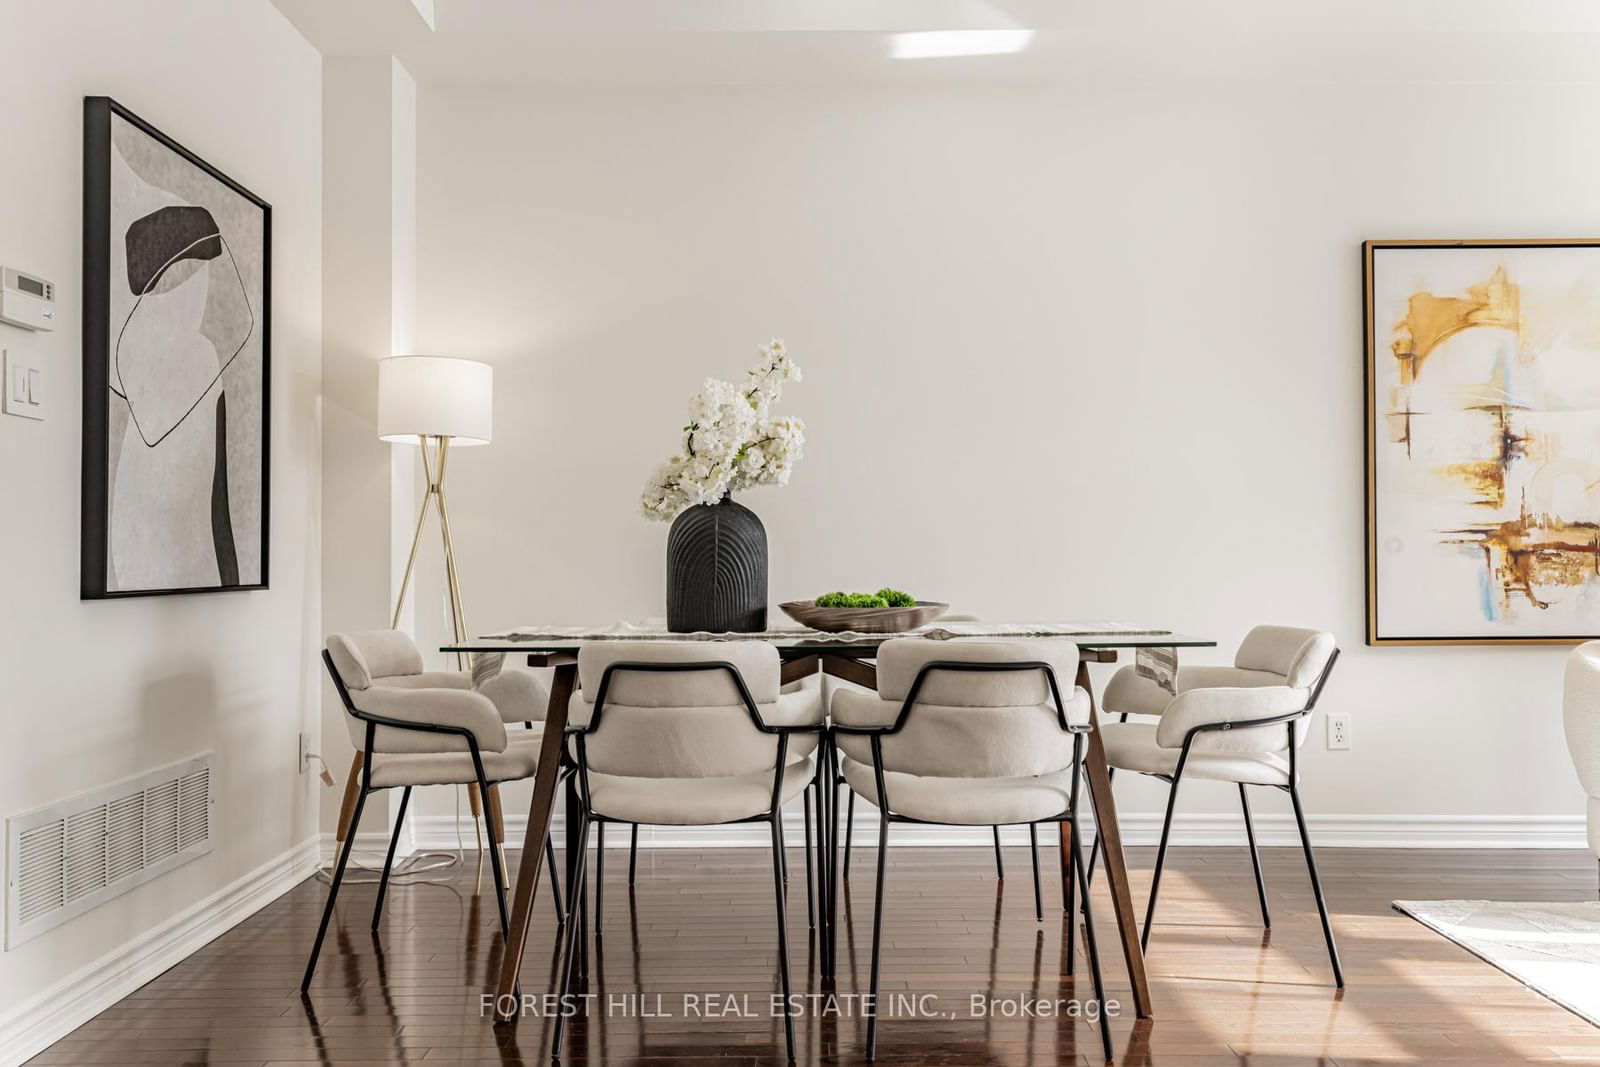
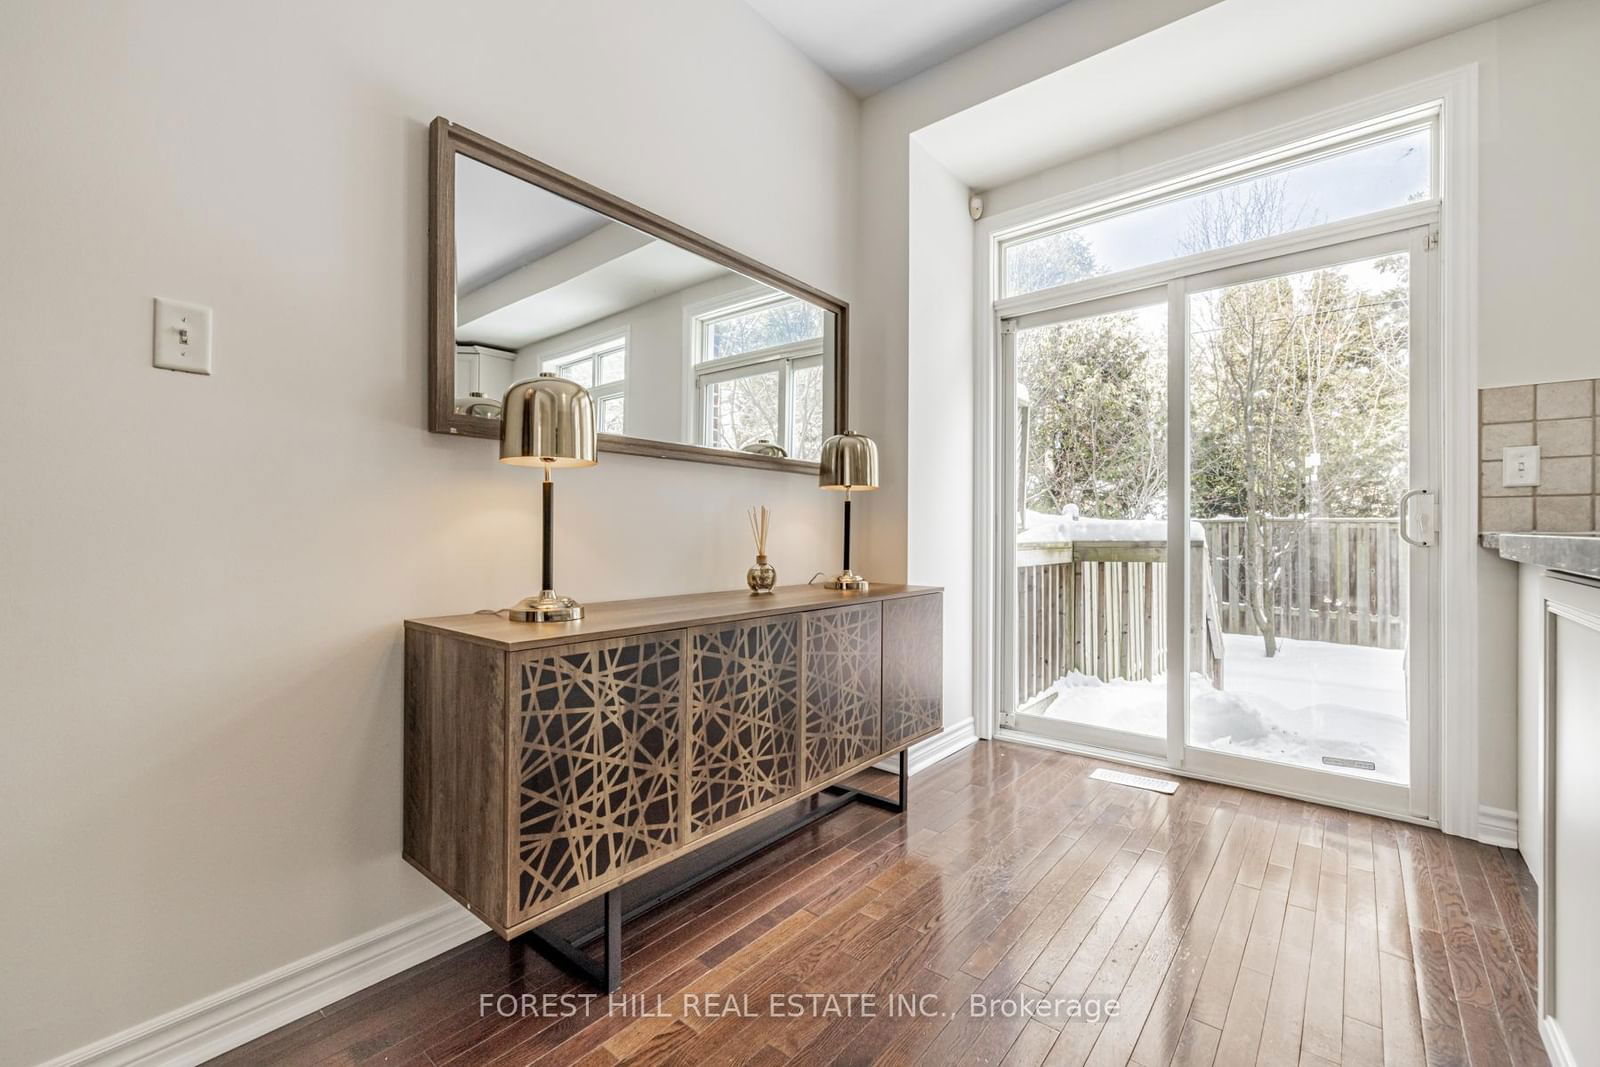
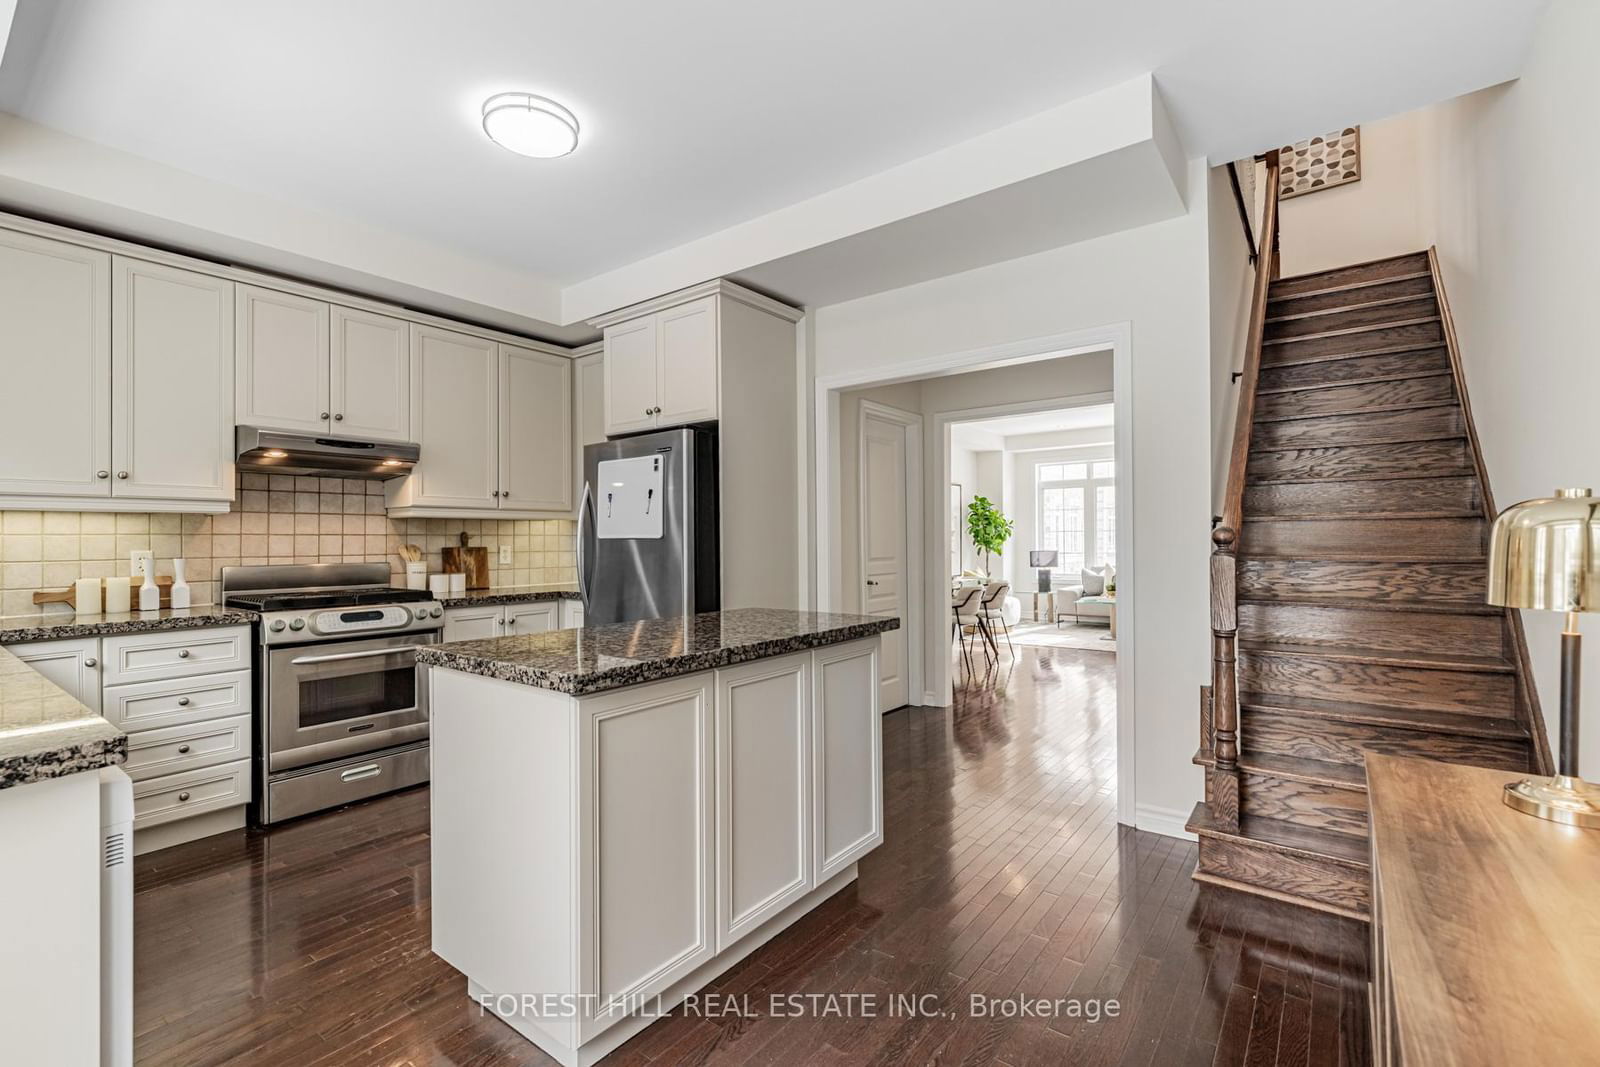
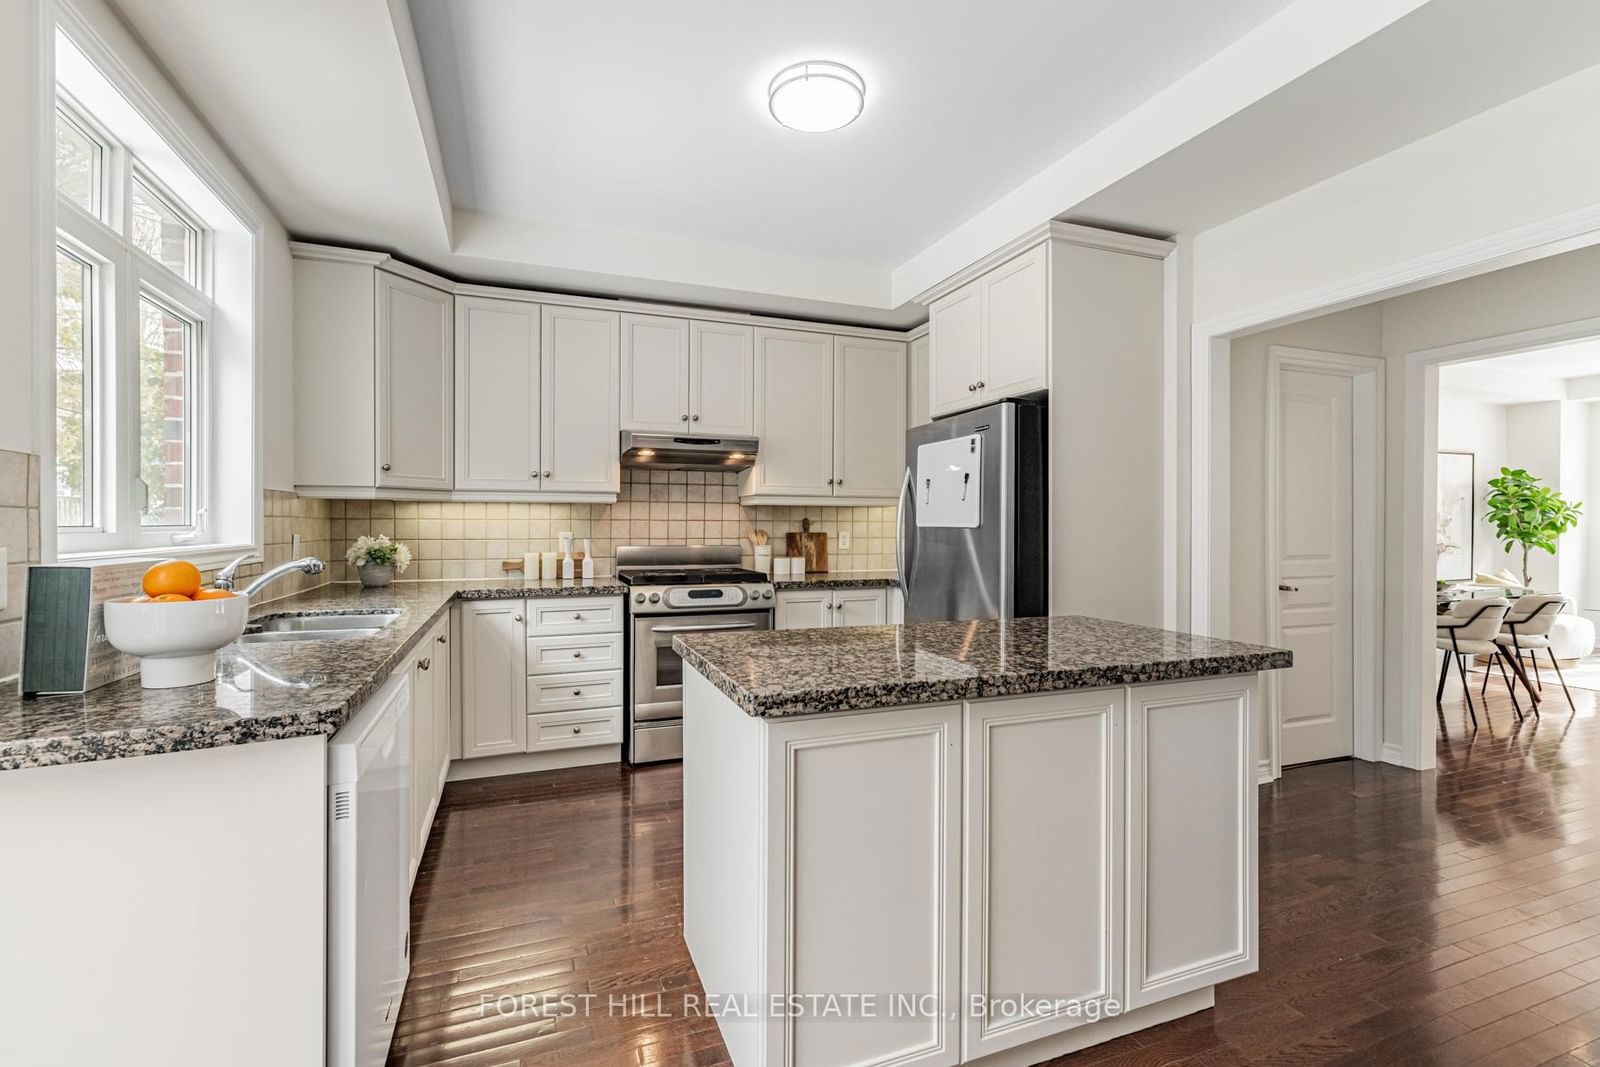
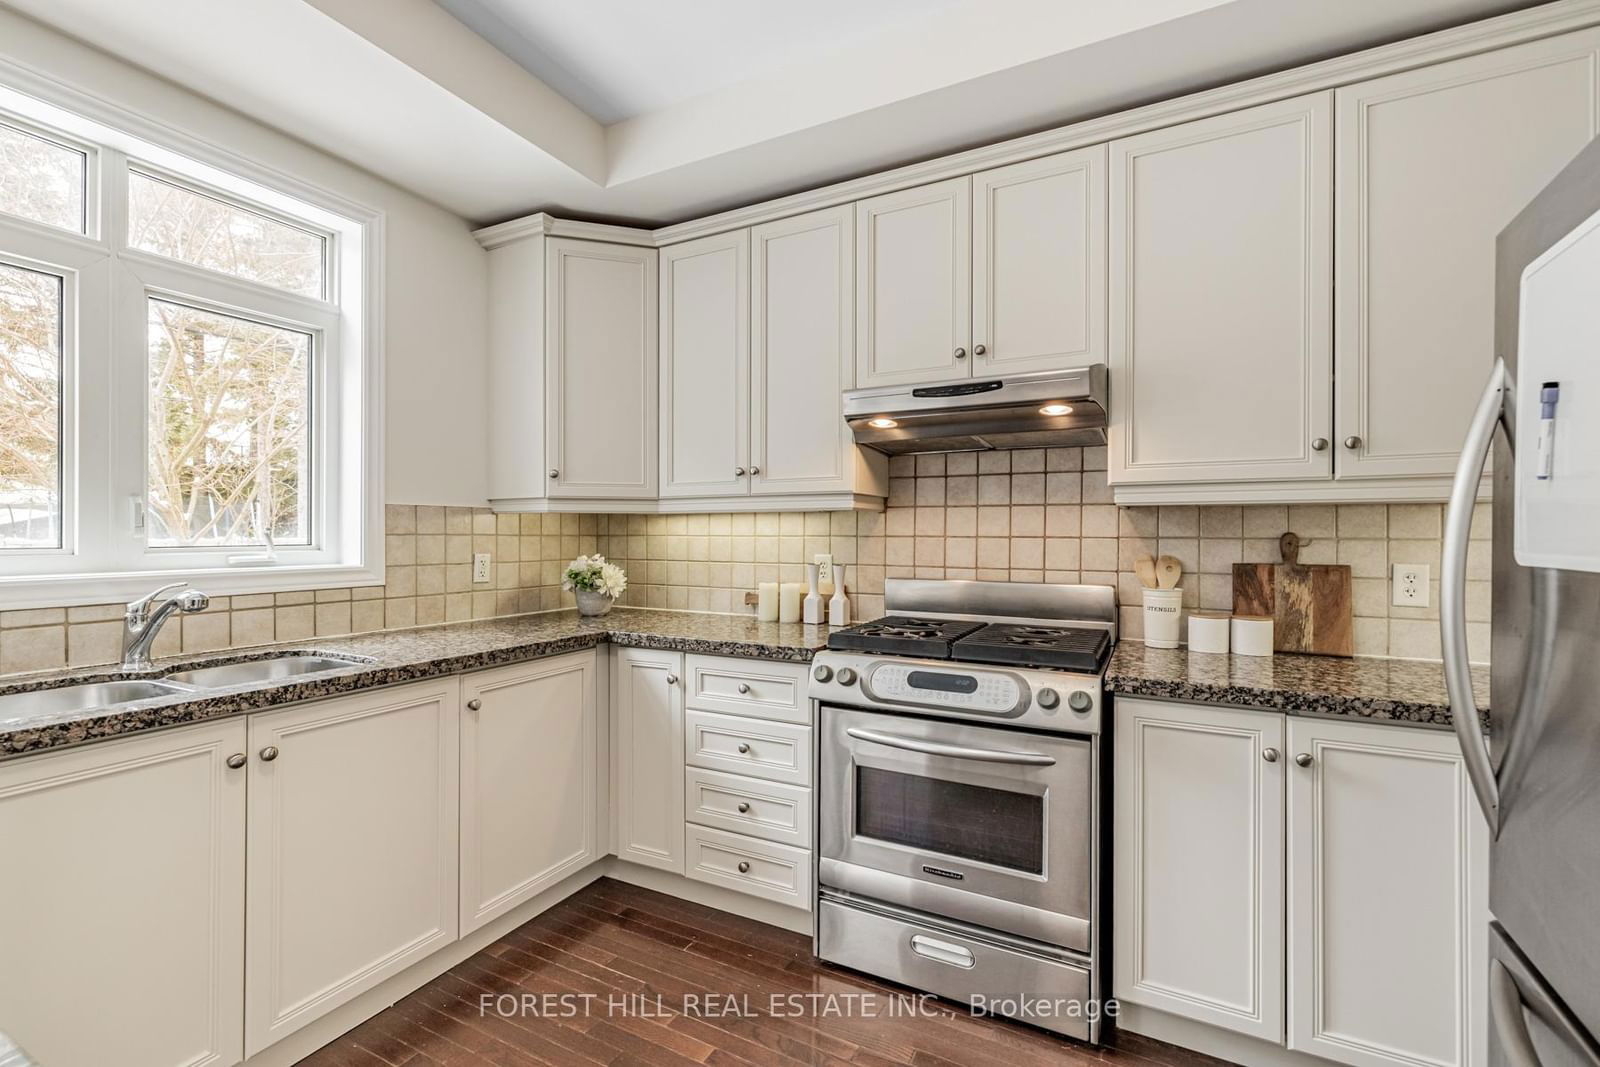
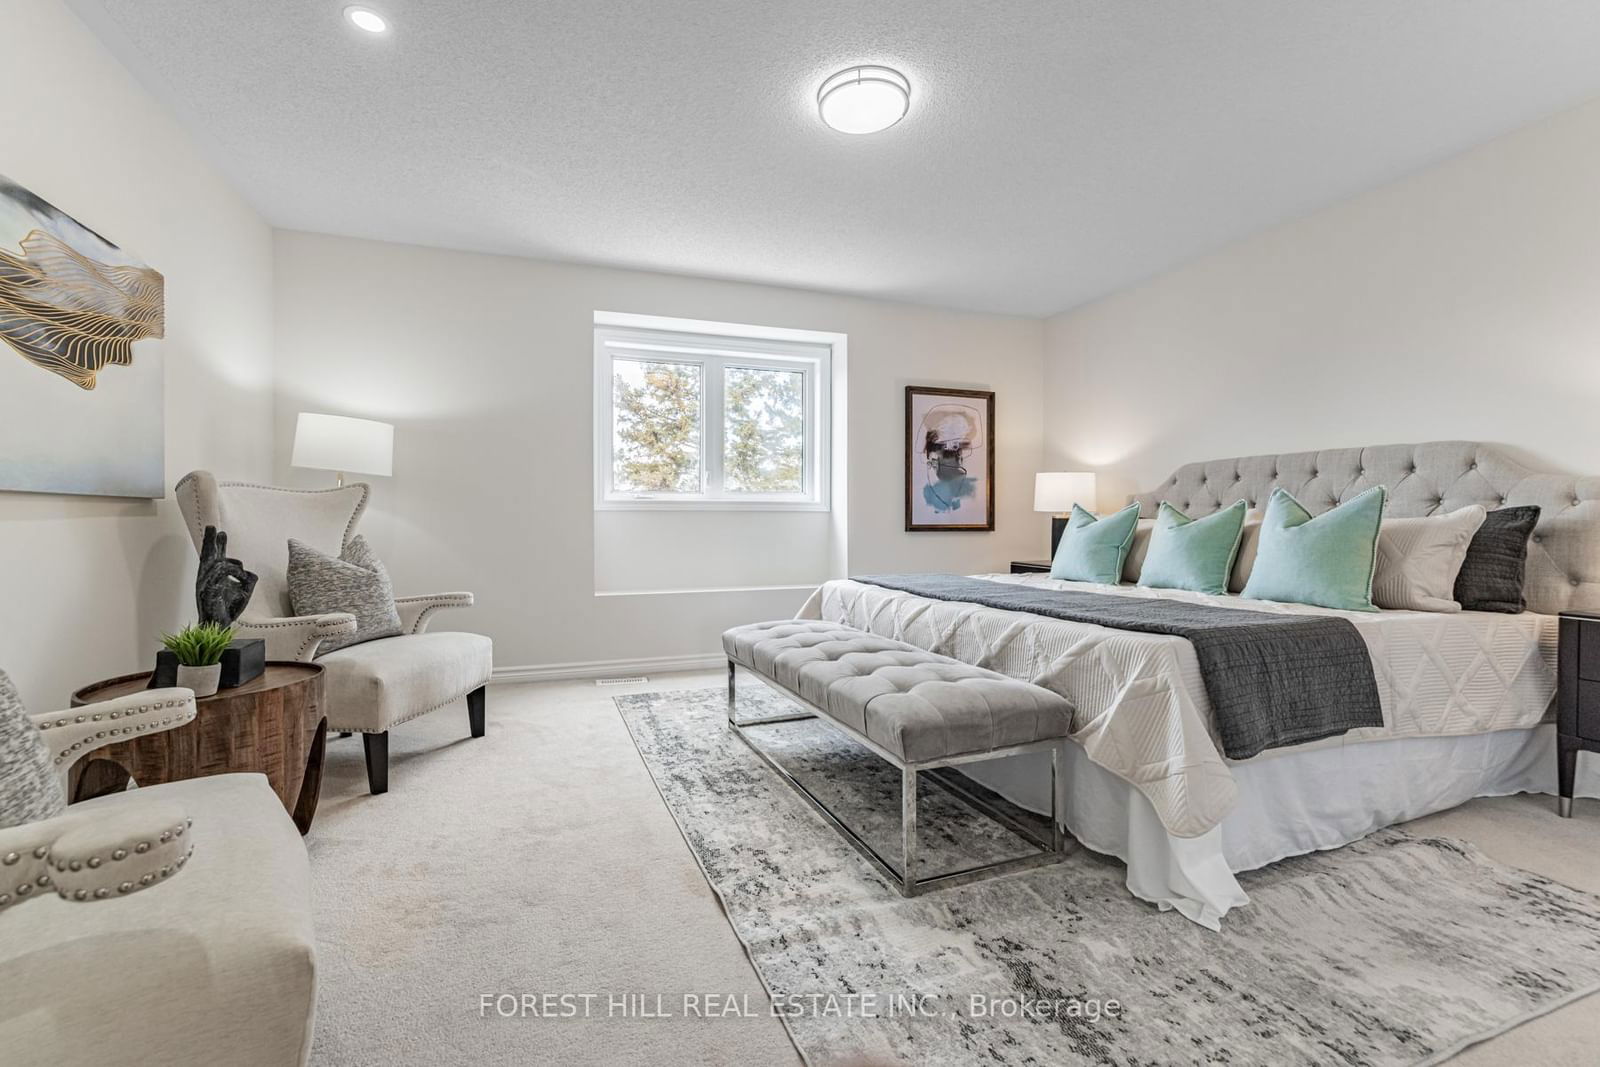
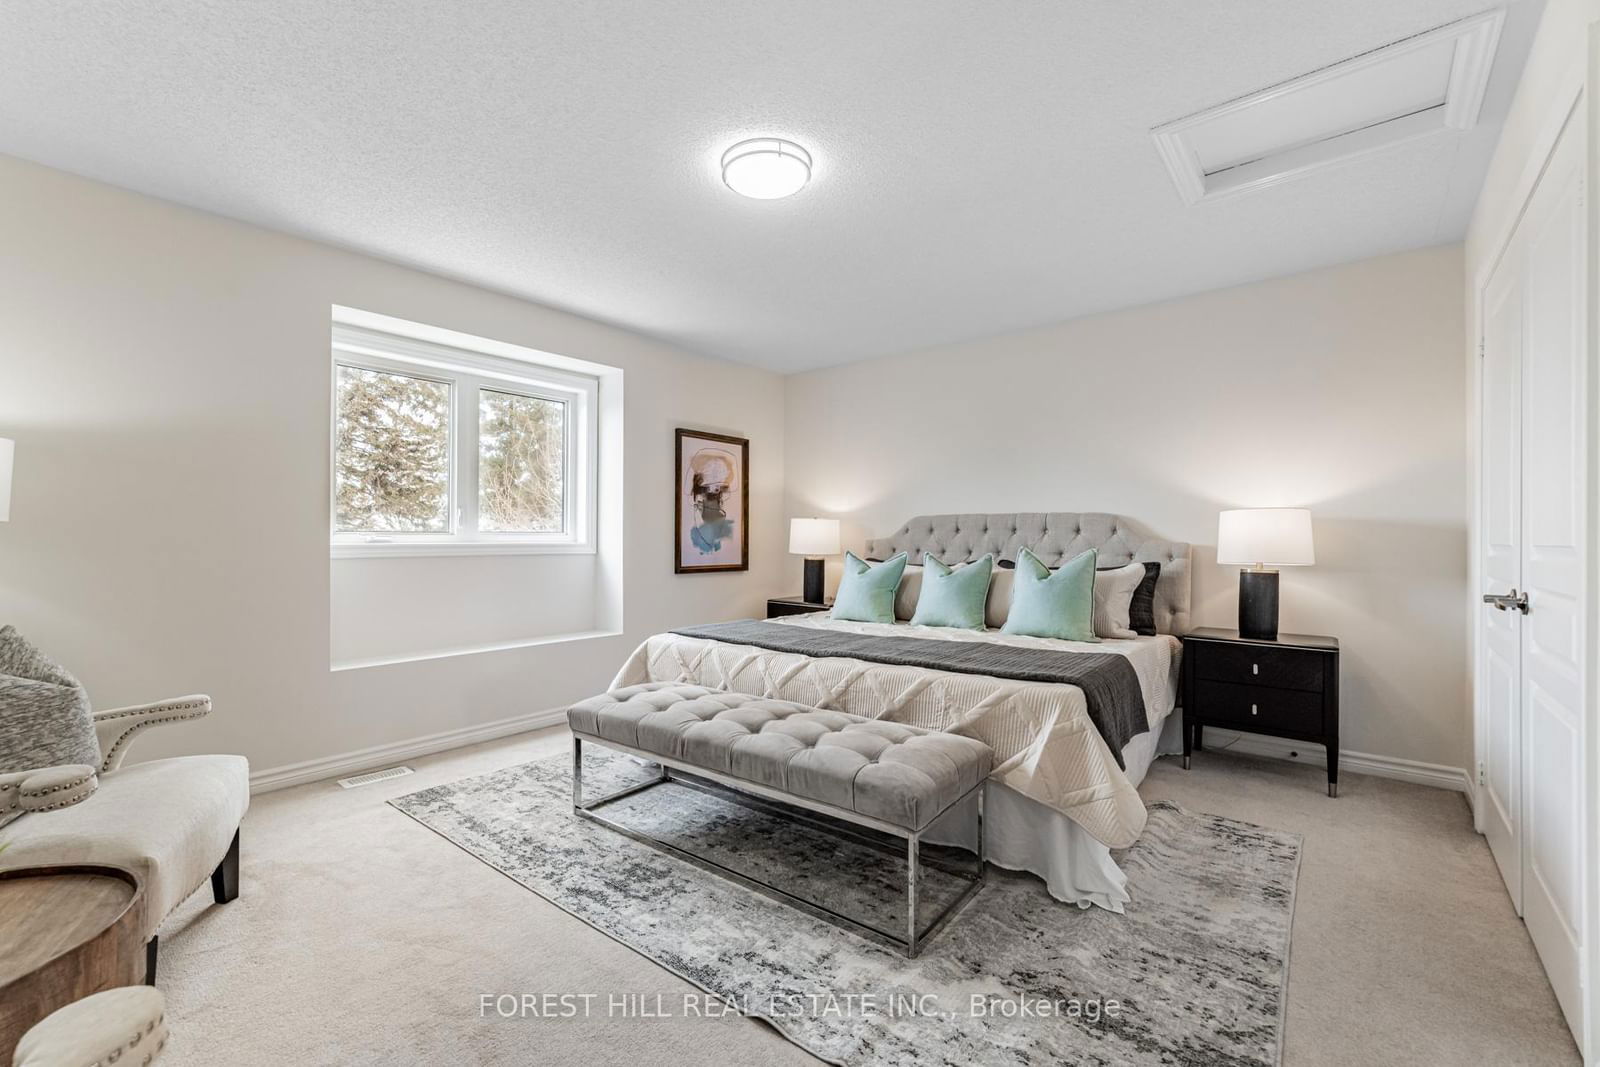
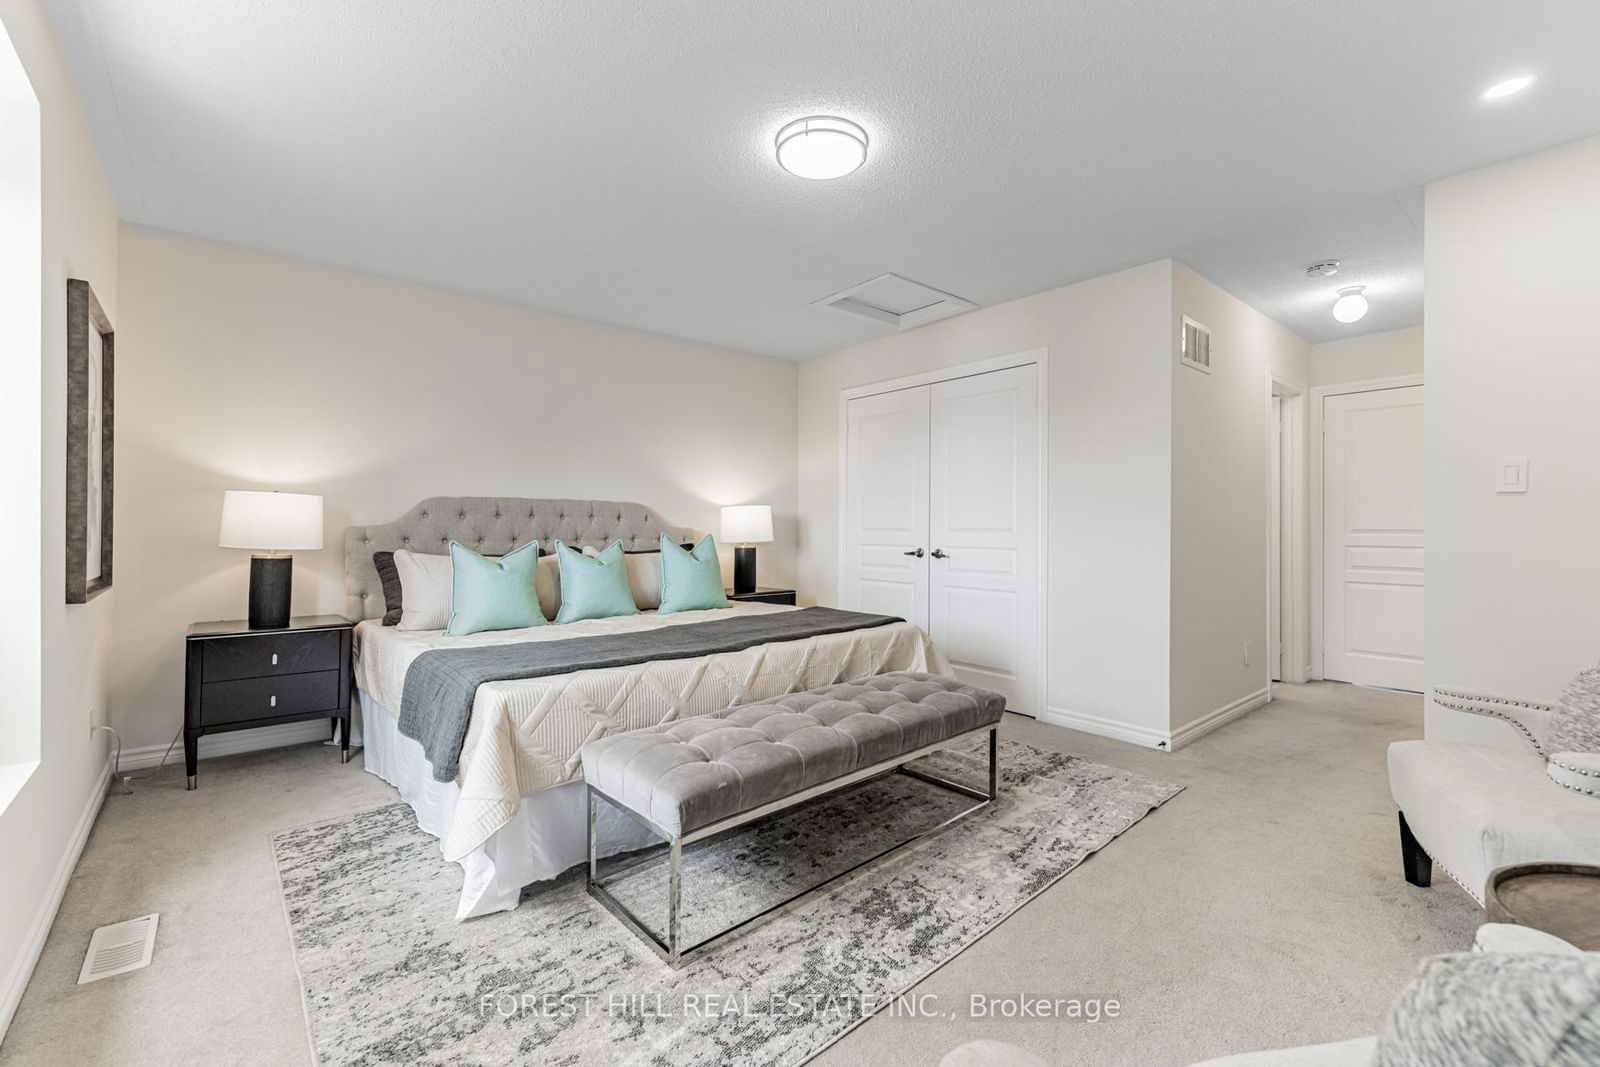
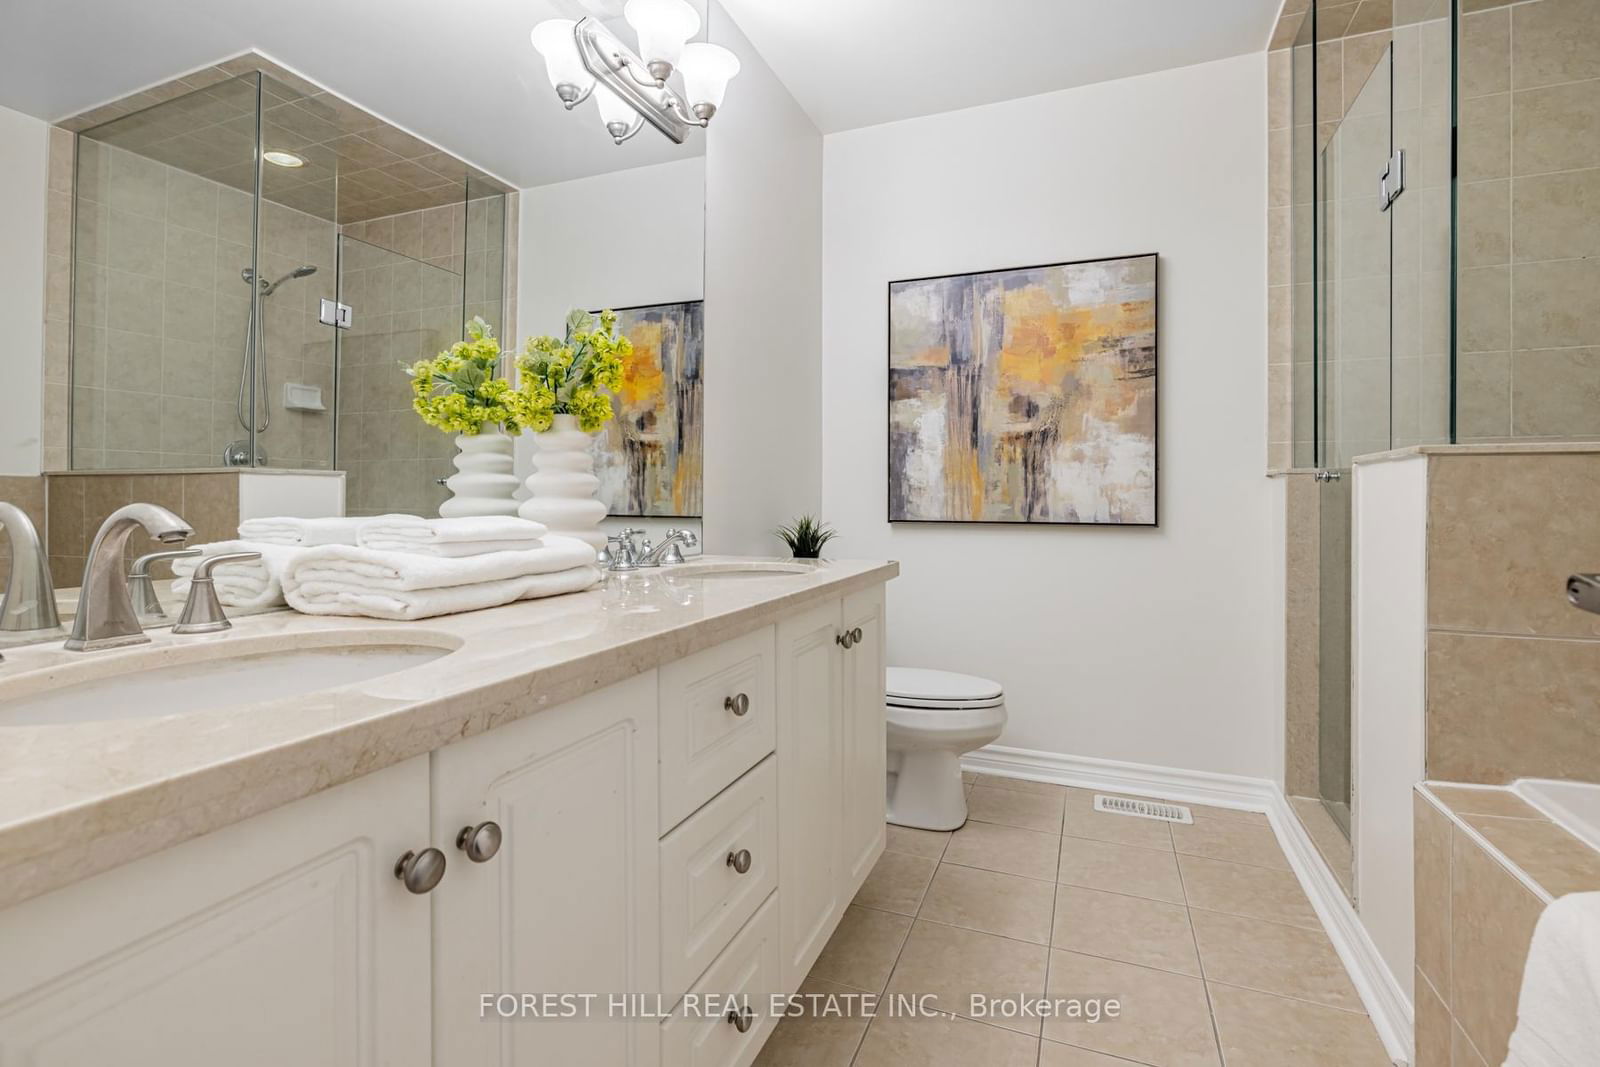
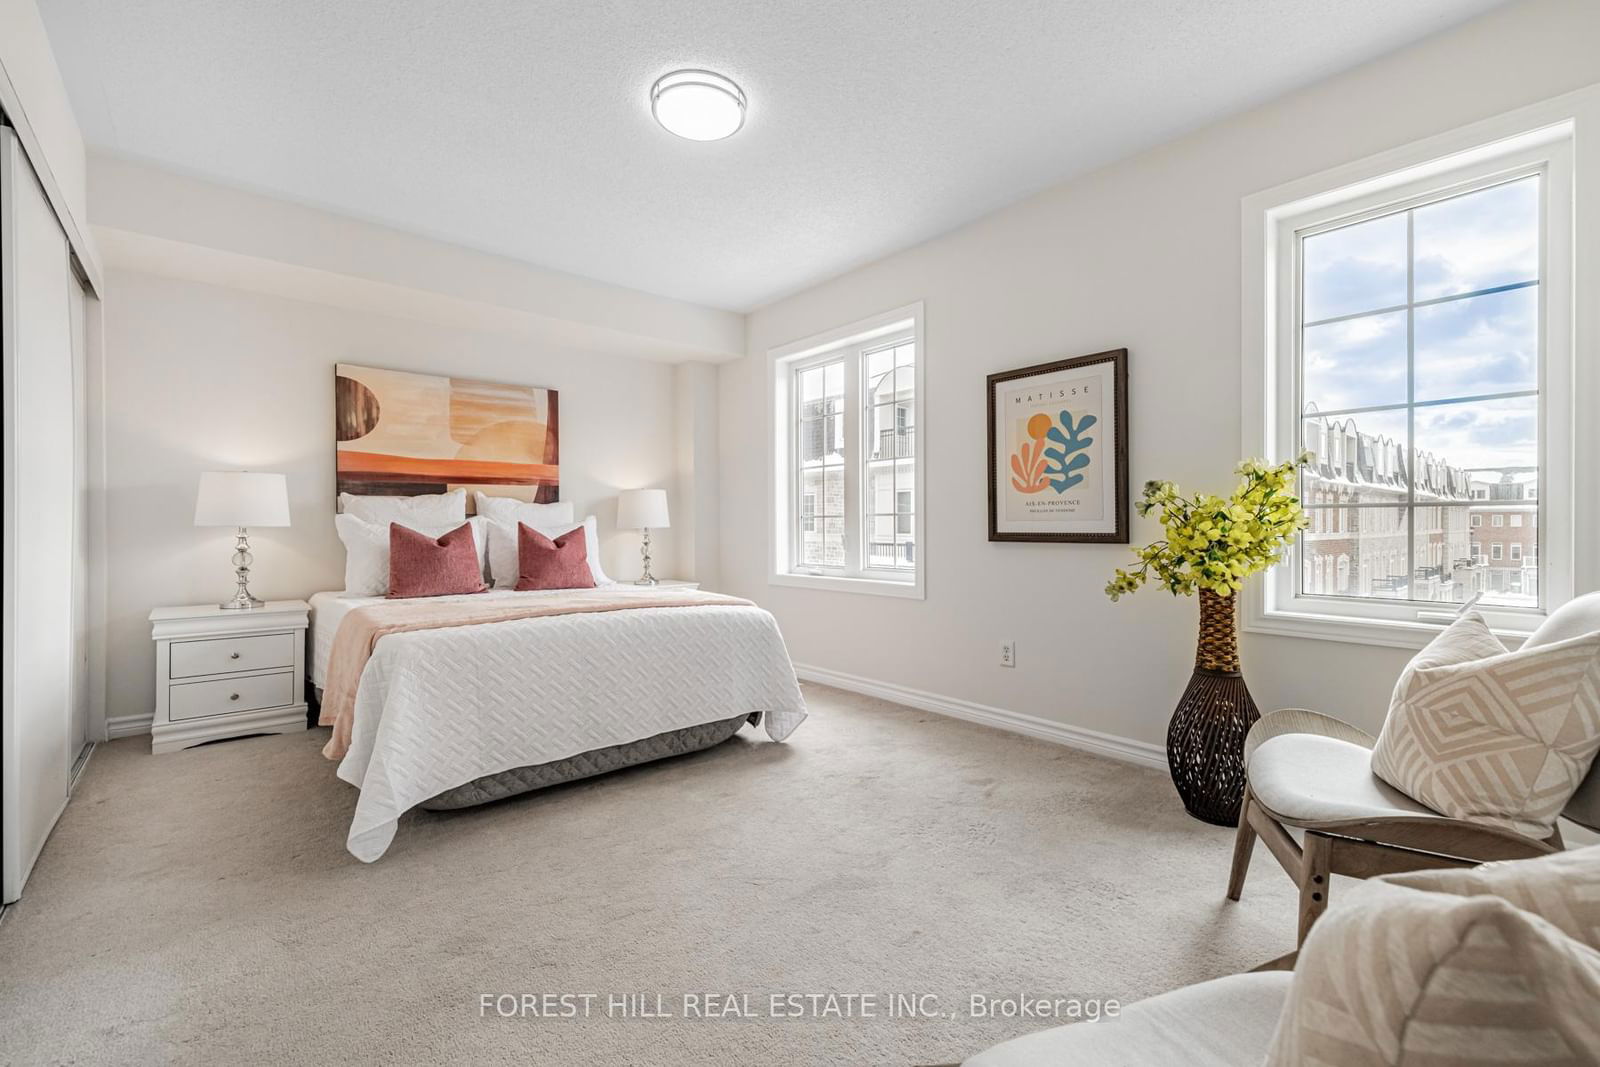
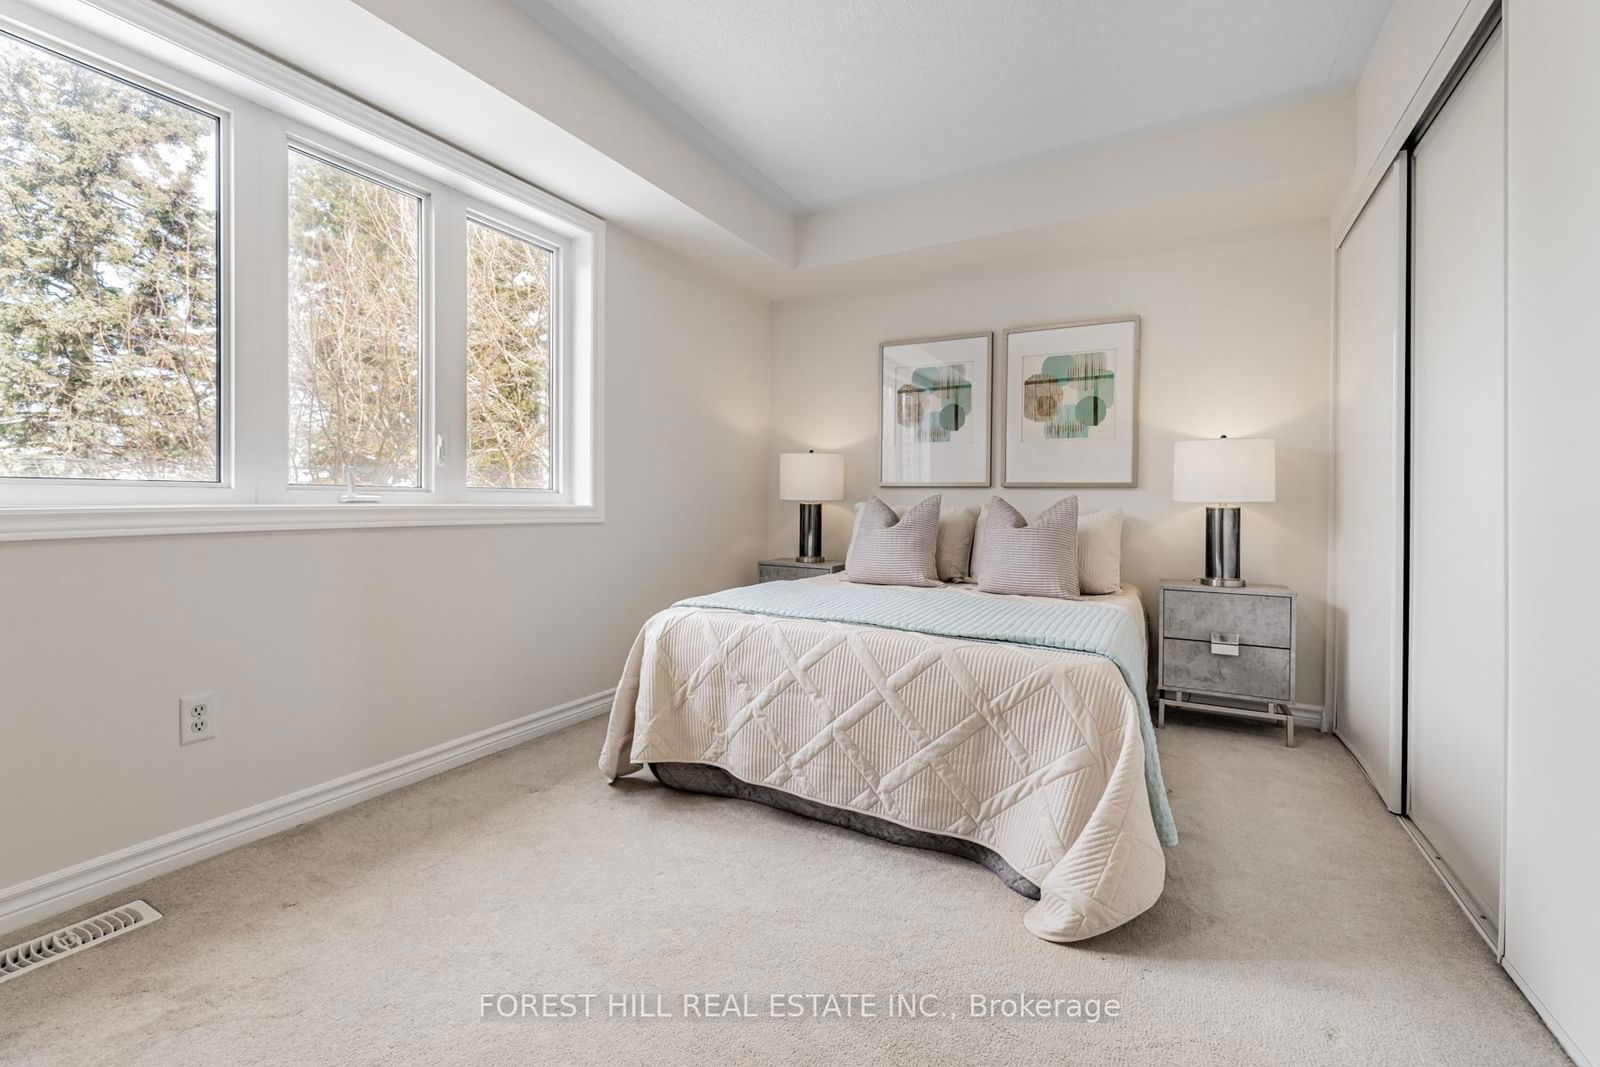
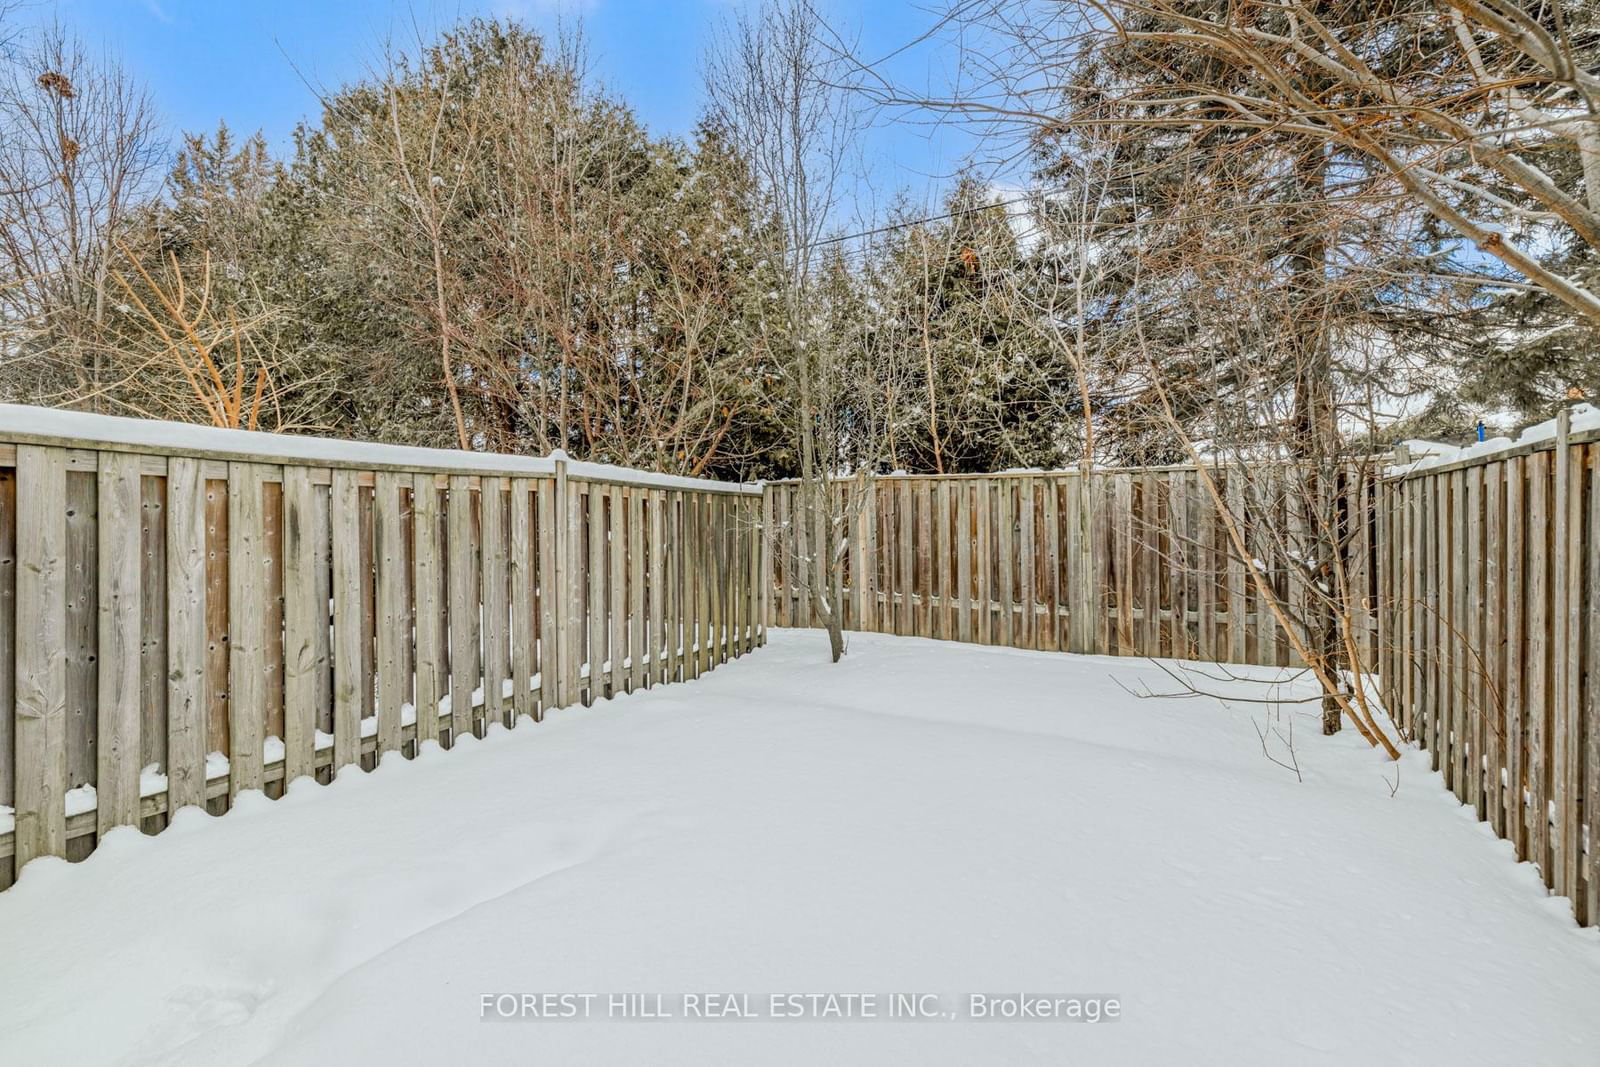
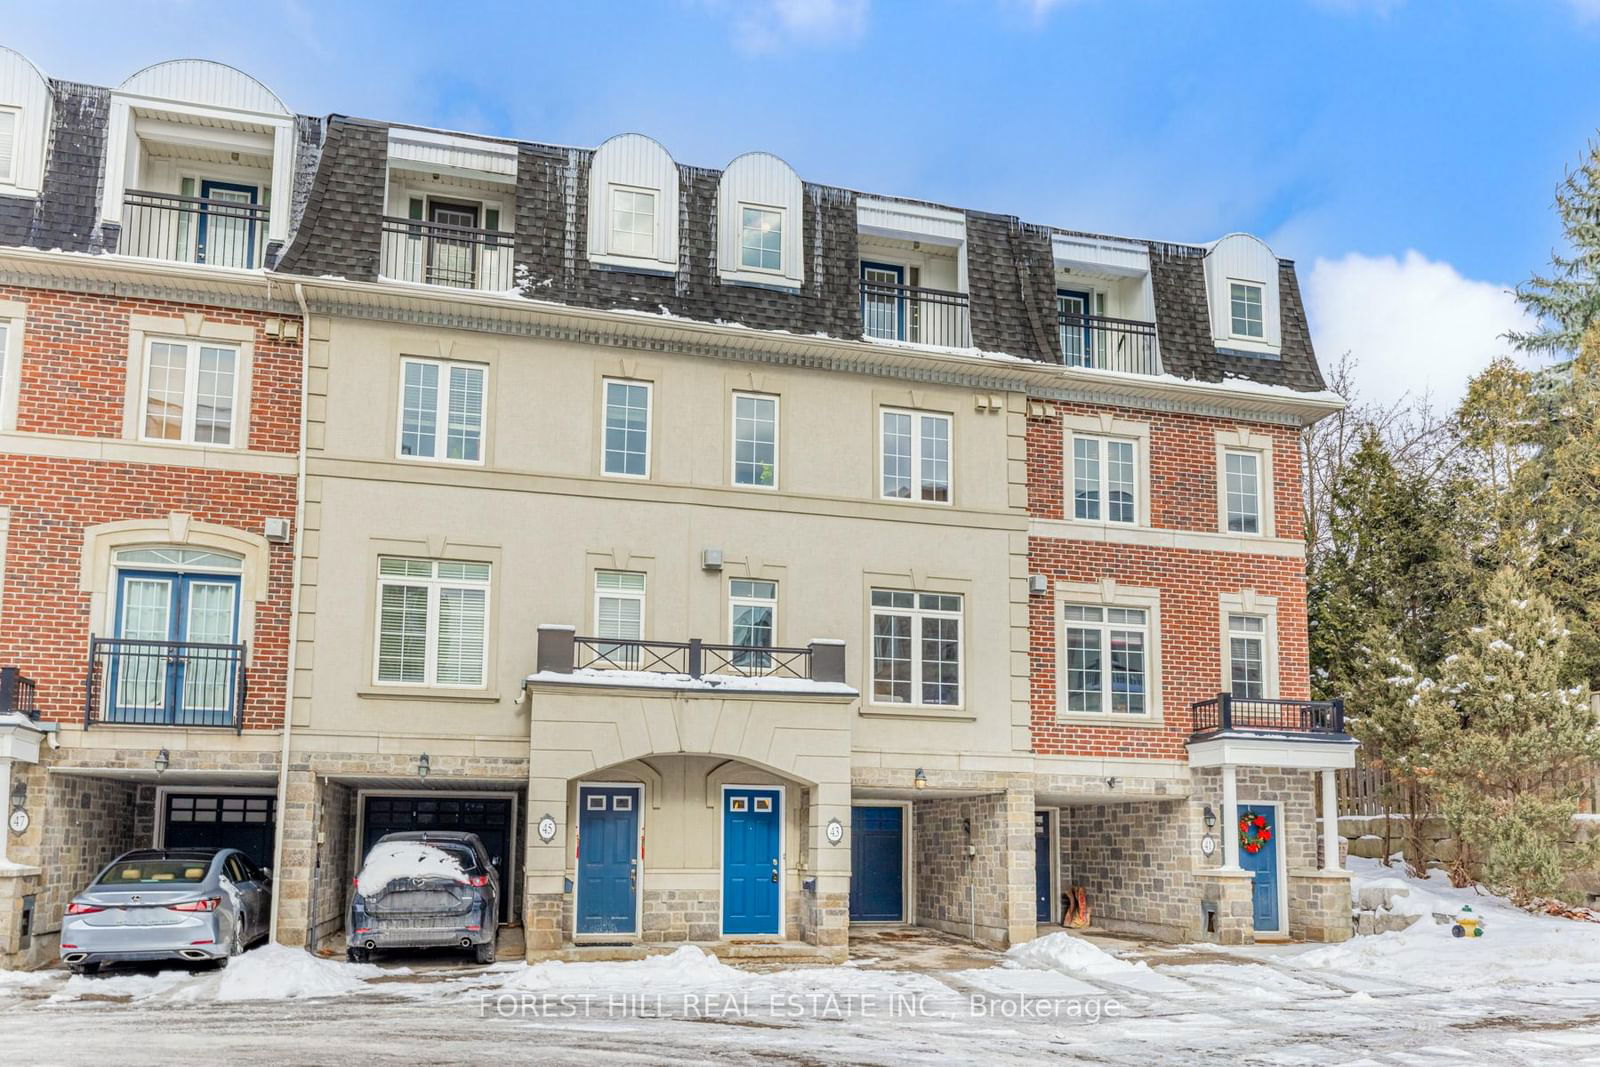
***Immaculate Condition------Discover This Beautiful Residence------"Stylish"--"Charming"----"Perfectly Move-In condition" Unit------Situated on a Quiet-Inside & One of the best spot of Complex(This unit back yard is backing onto a Detached home backyard)***Shows Beautifully--------Open/South--North facing views(Open Sunny----Quiet/Private Backyard)***Unit with Abundant Natural Sunlight(S.N Exposure Unit)***Spacious----Almost 2000Sf as per Mpac****Welcoming to a Spacious foyer with a direct access from garage & utility room***Open Concept--Abundant Natural Sunlight of Living Rm & Dining Room with 9Ft Ceiling Heights & Enjoying of the warmth of gas fireplace**Enjoy a private-garden view, eat-in Kitchen with an easy access to the very Private & Tranquil-backyard**well-proportioned bedrooms & functional 2nd floor laundry room**Relax-Cozy family Rm or home office to access a private balcony & spacious primary bedroom features a 5pcs ensuite & closet***Comfort/tranquil & private backyard(backing onto a detached home's backyard---Serene retreat!)----Located just steps from the popular Edithvale Community Centre,parks,shops and more
*Fridge,Kitchenaid Gas Stove/Oven,B/I Dishwasher,Front-Load Washer/Dryer,Gas Fireplace,Newer Furance(2018),Newer Shingle Roof(2020),Private-Tranquil Backyard,Rough-In Central Vaccum(As Is Condition),2Cars Pkg Spots(1 Car Garage+1Car Driveway),Visitors Pkgs(Townhouse Complex),Granite Countertop,C/Island,Hardwood Flr, Pot Lighting,Private Balcony,Freshly Painted (2025)-----Maintenace Fee $260 Per Month Includes Water,Landscaping,Road Maintenance(Snow Removal)
Living
Dining
Kitchen
2nd Br
3rd Br
Primary
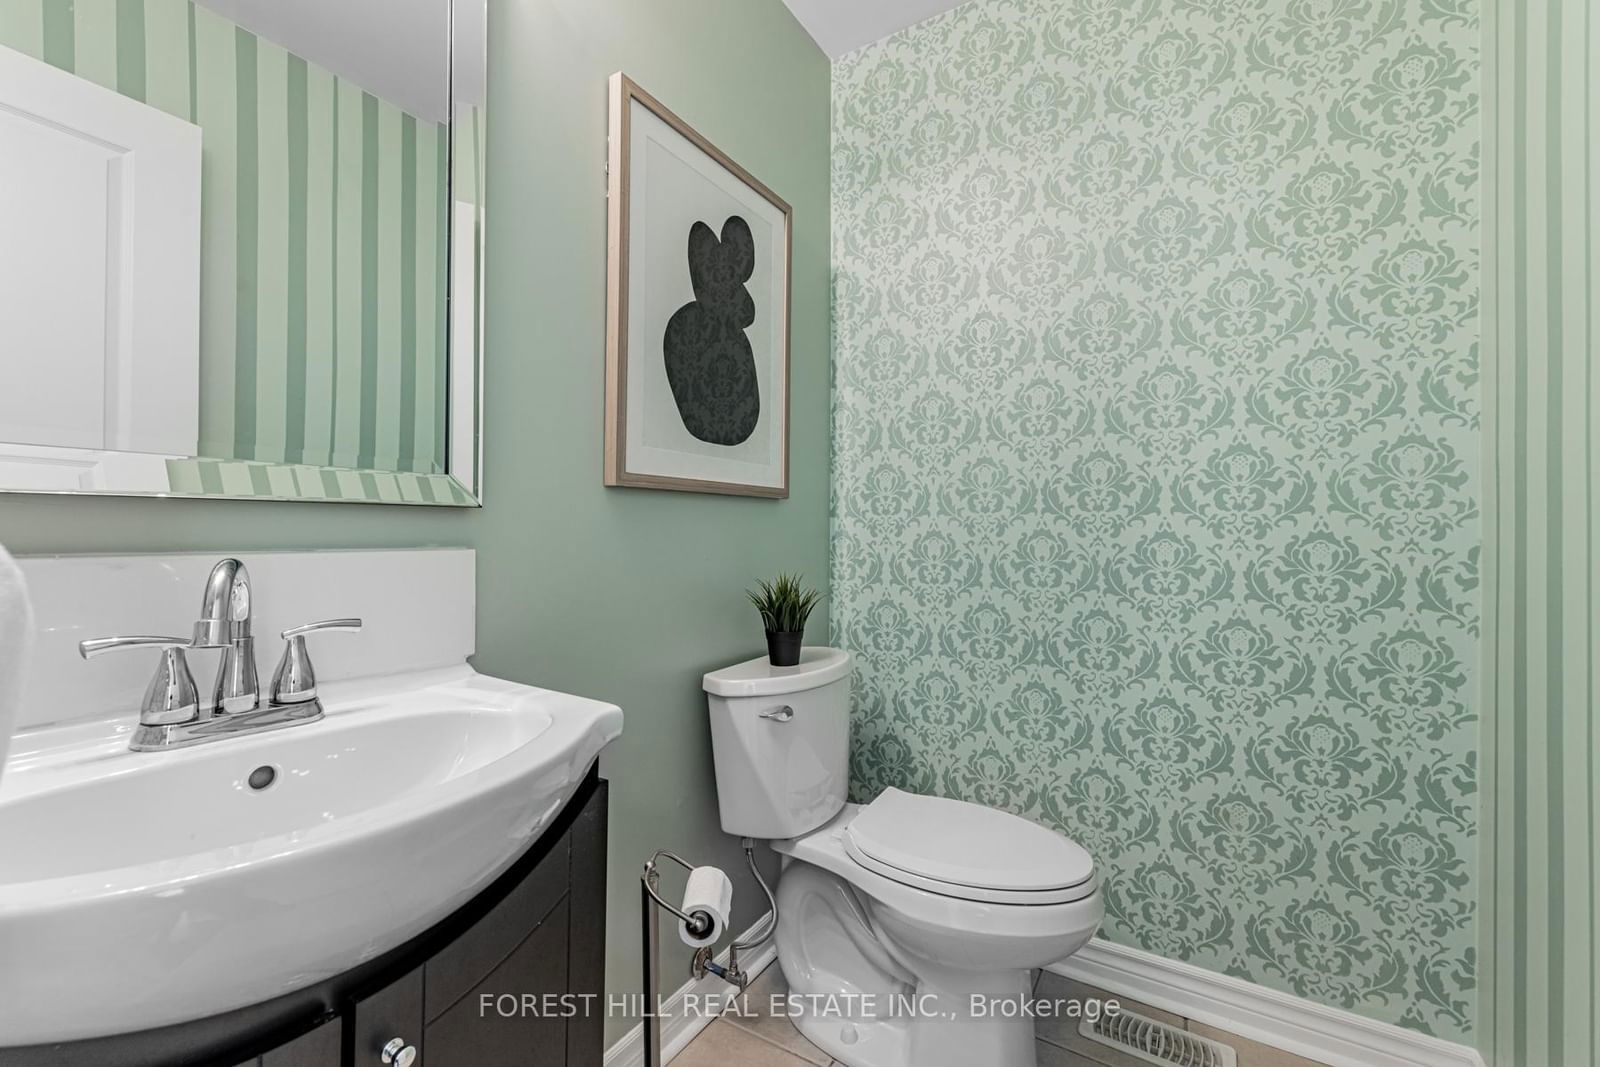
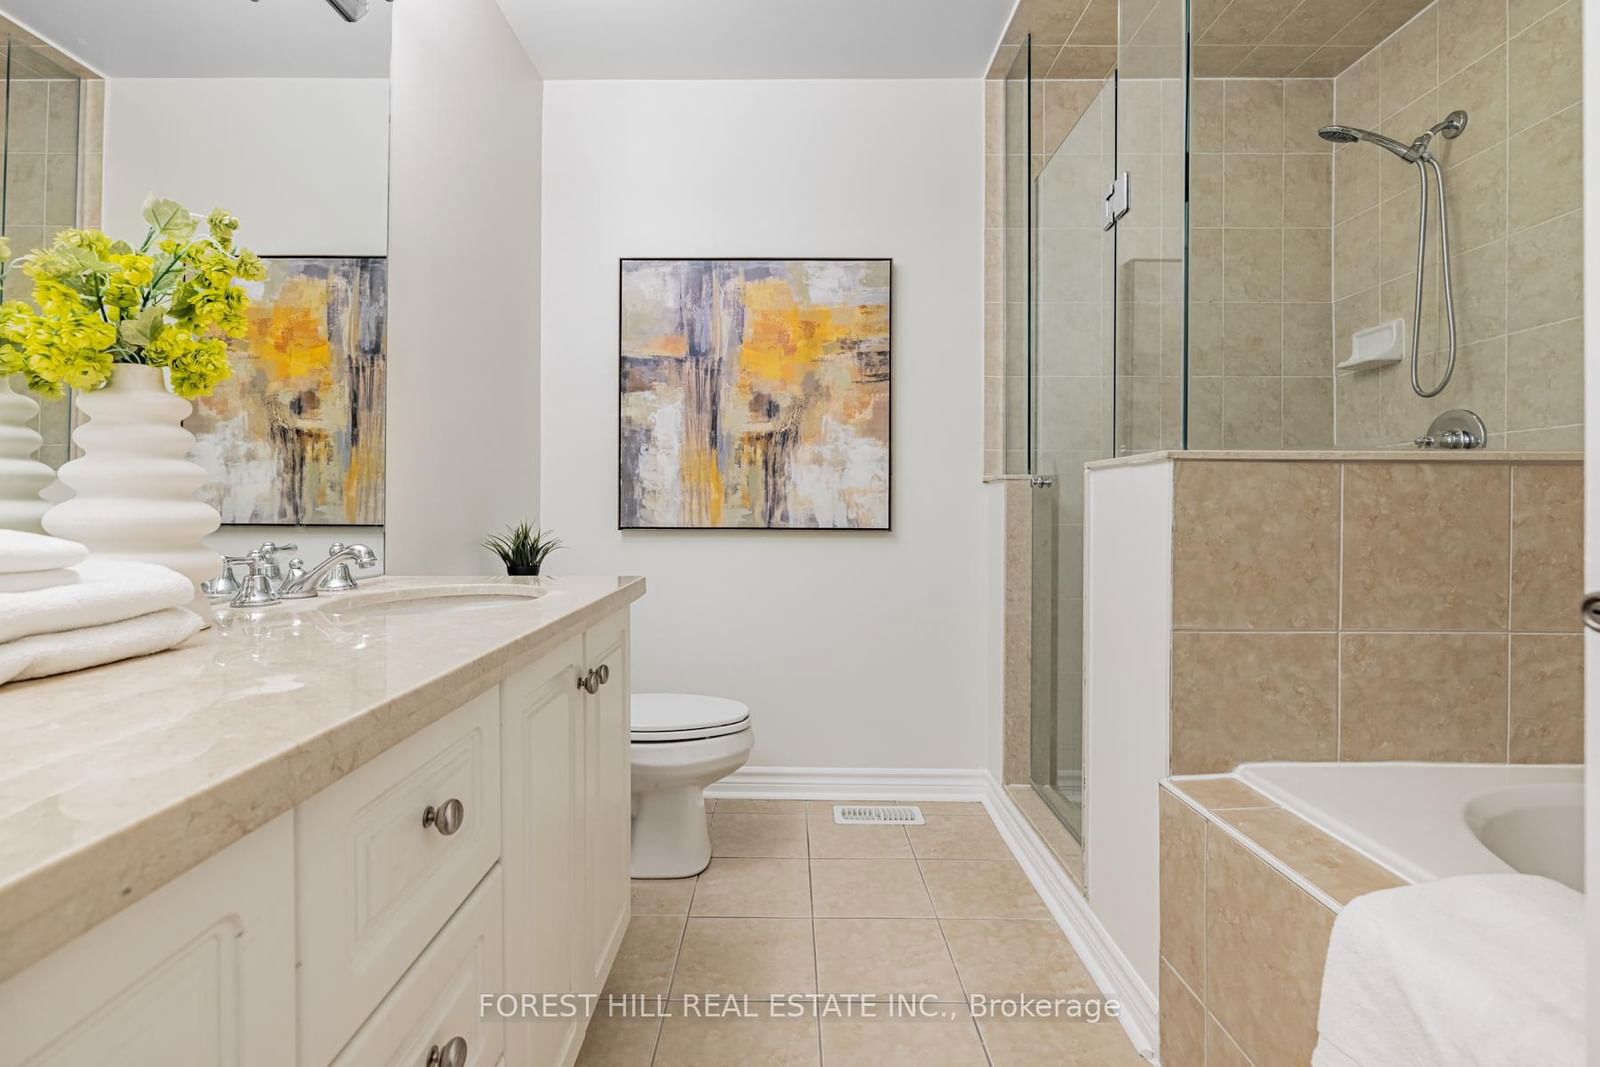
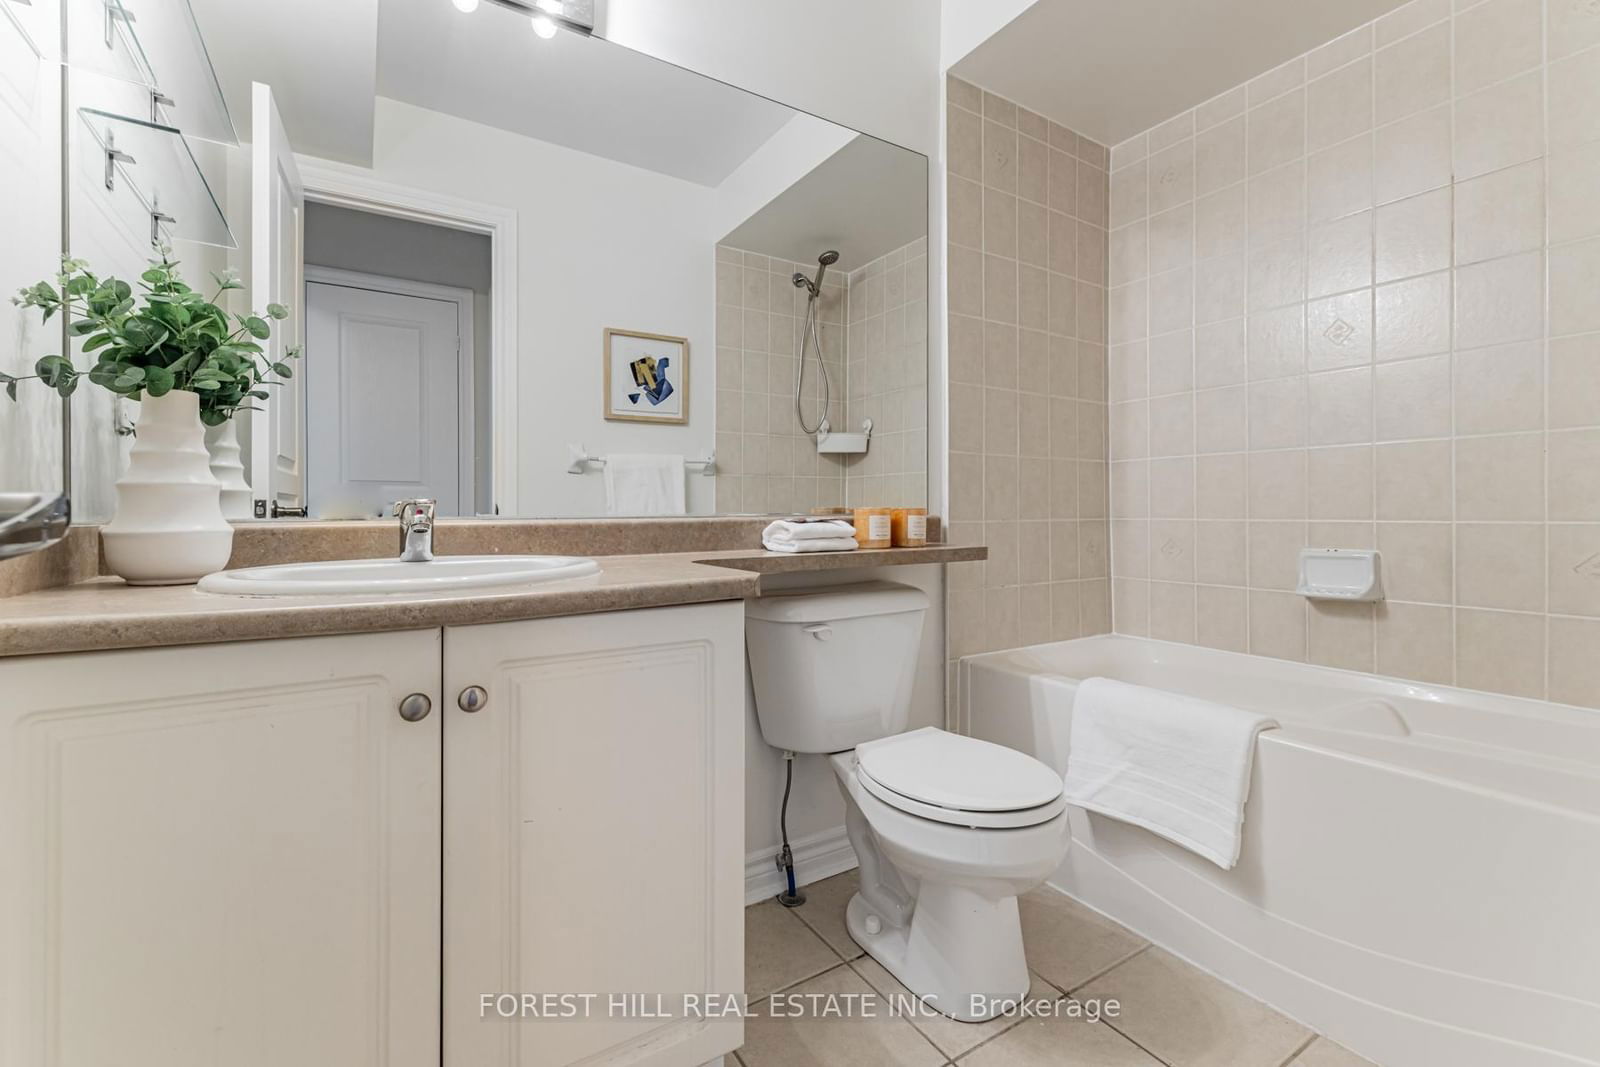
Bathroom
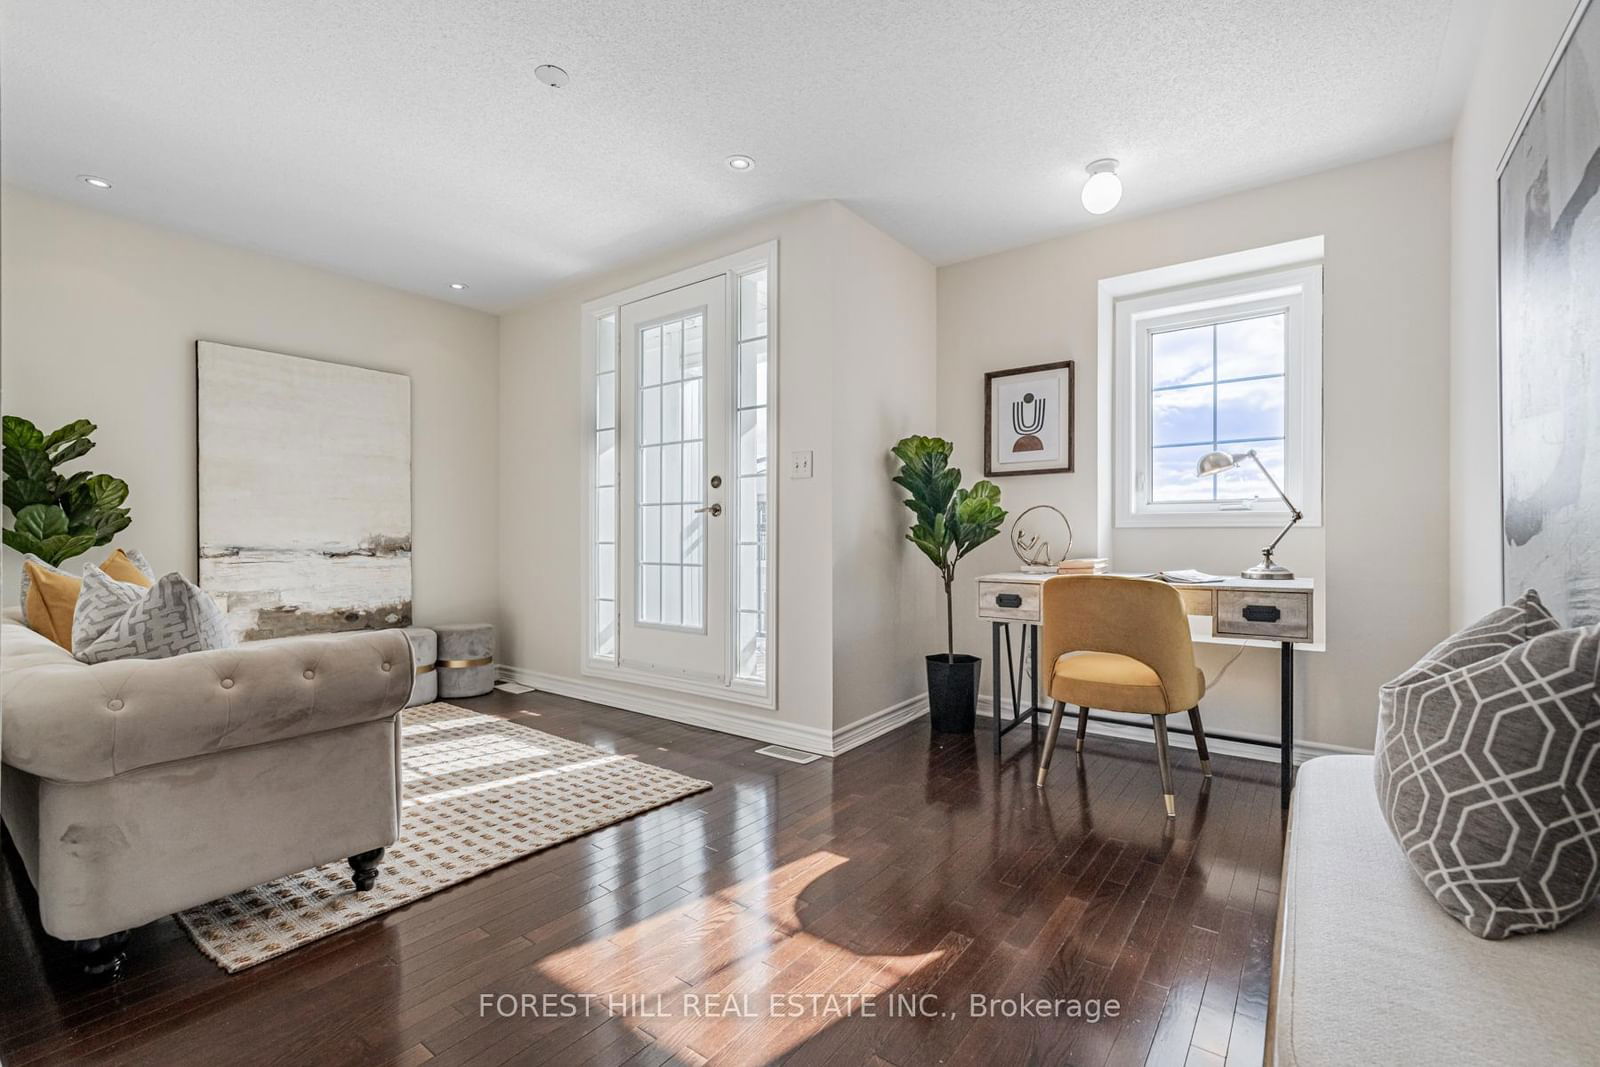
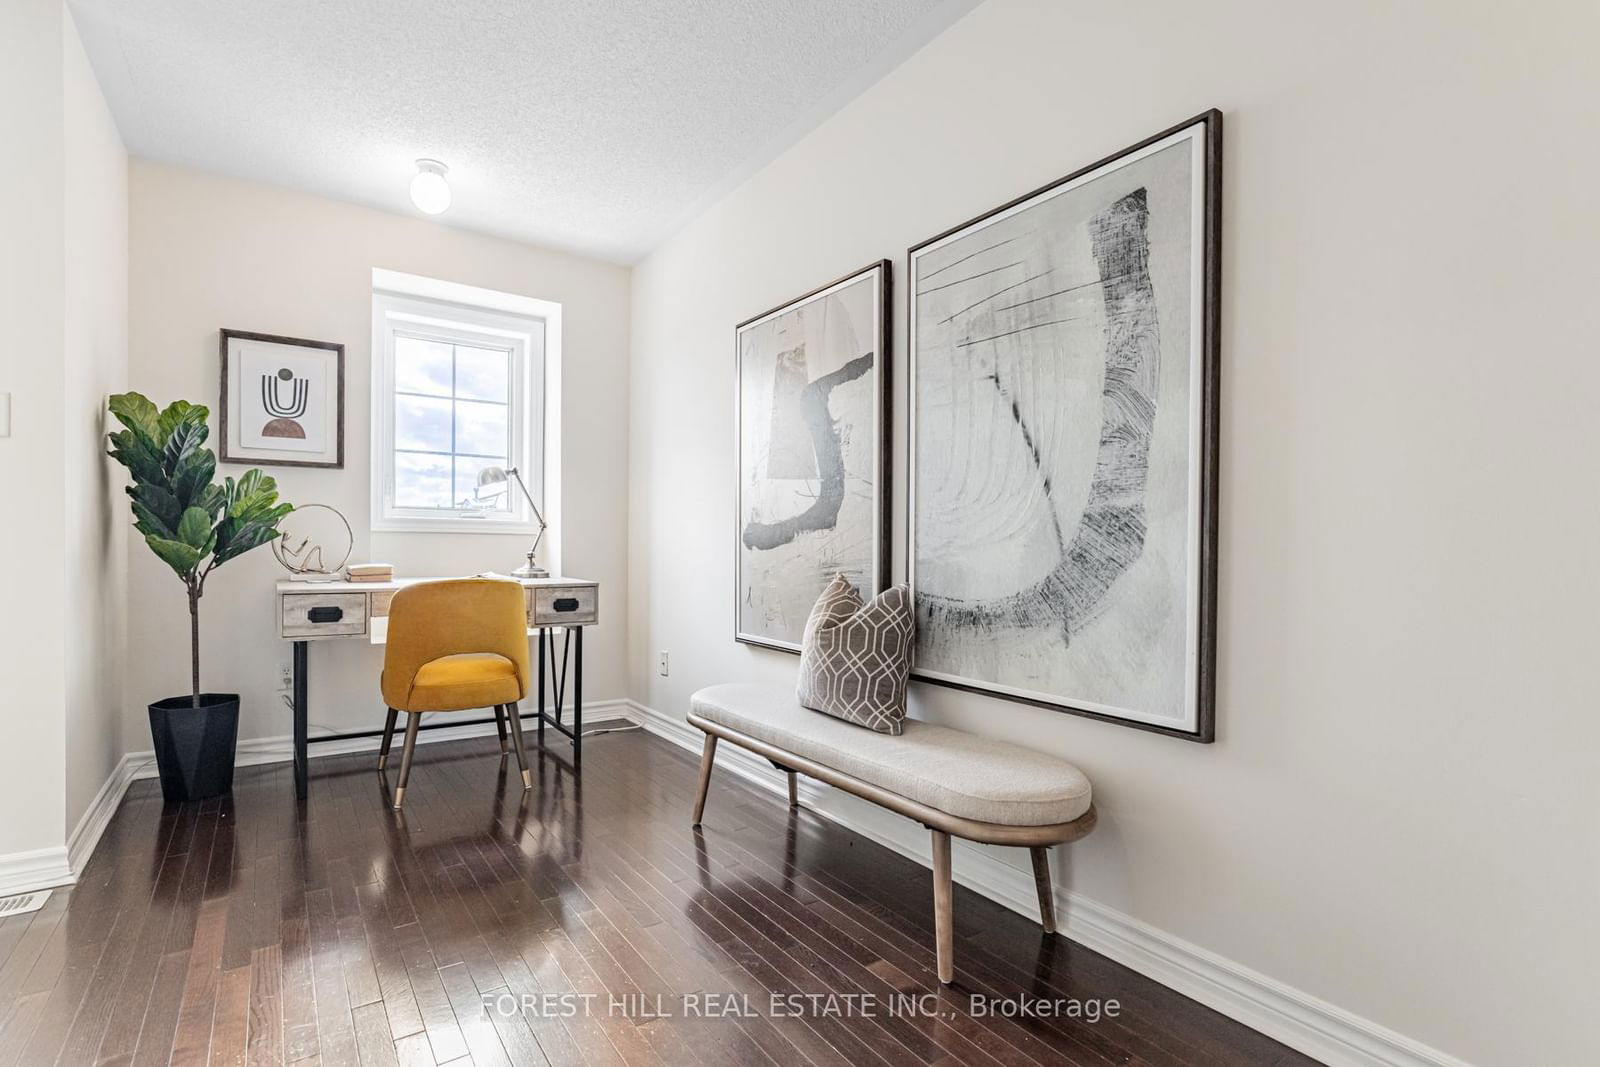
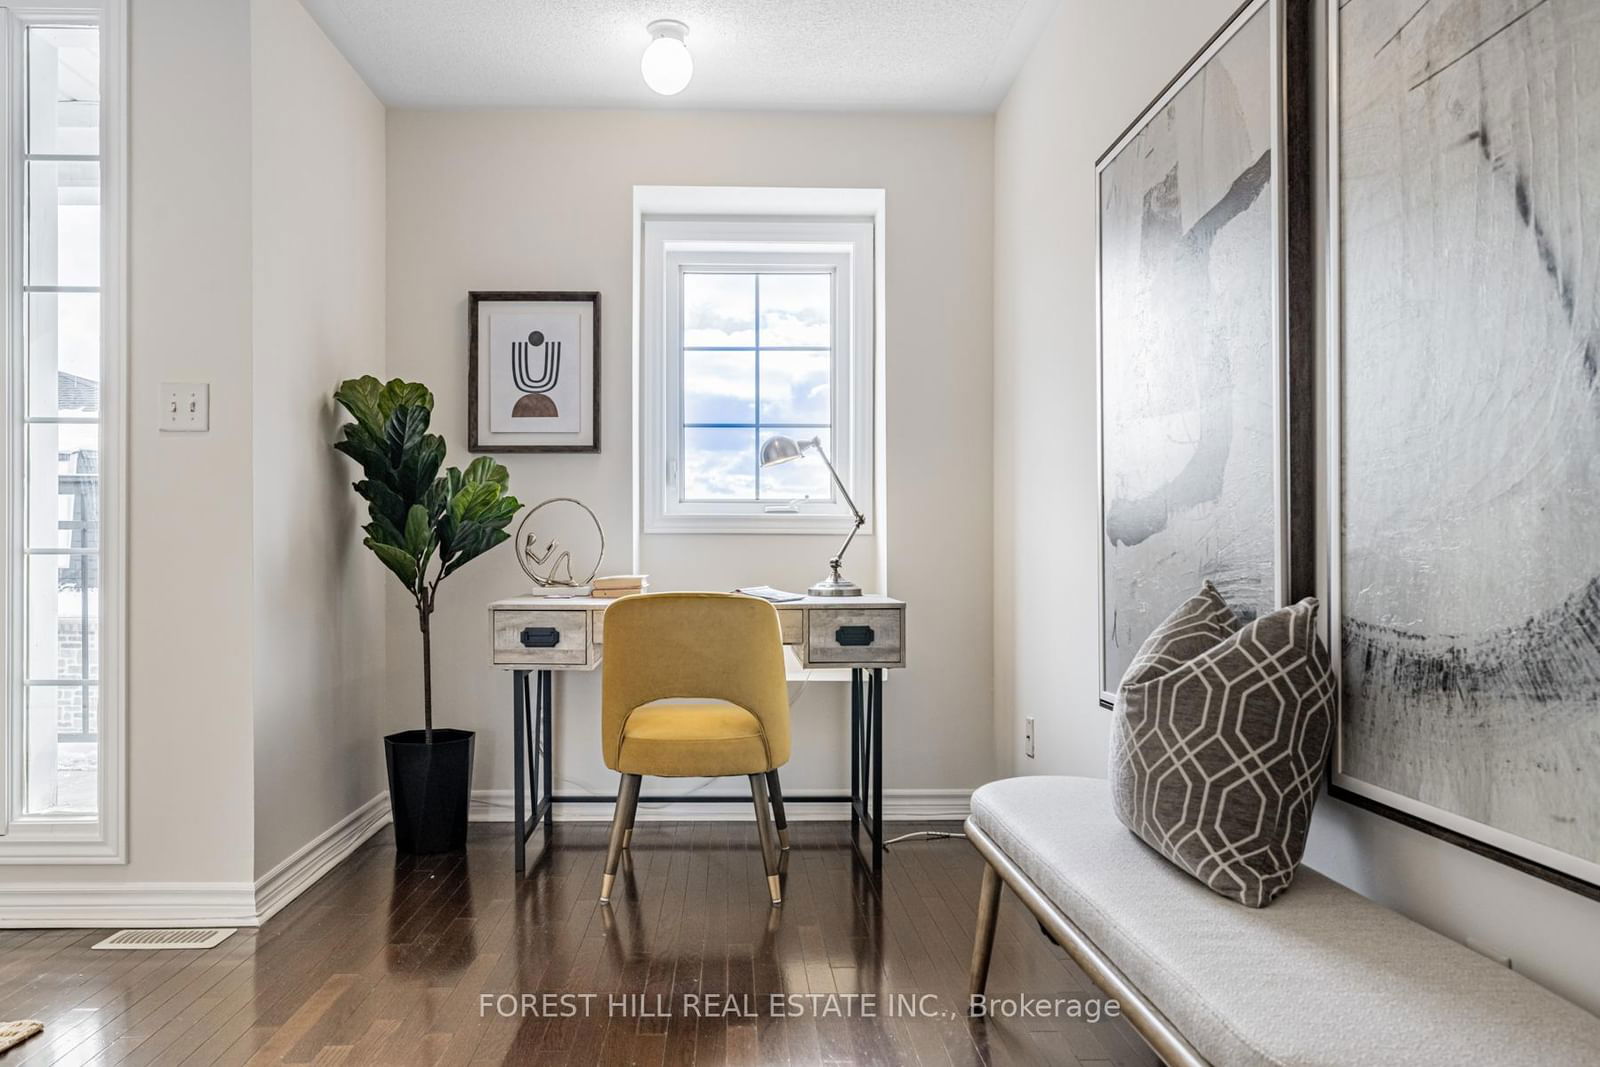
Family
The graph below compares the average list price and average sale price of homes in this neighborhood by month for the last 24 months. When average sale price is greater than average list price, this may suggest a buyer's market. When average sale price is lower than the average list price this may suggest a seller's market.
The graph below illustrates the average days on market for homes in this neighborhood. The yellow area may indicate a buyer's market, the green area may indicate a balanced market and the red area may indicate a seller's market.
Sales Representative, Century 21 People’s Choice Realty Inc., Brokerage
(647) 576 - 2100